AMD Ryzen 7 7800X3D vs. Intel Core i9-14900K: The Definitive Test
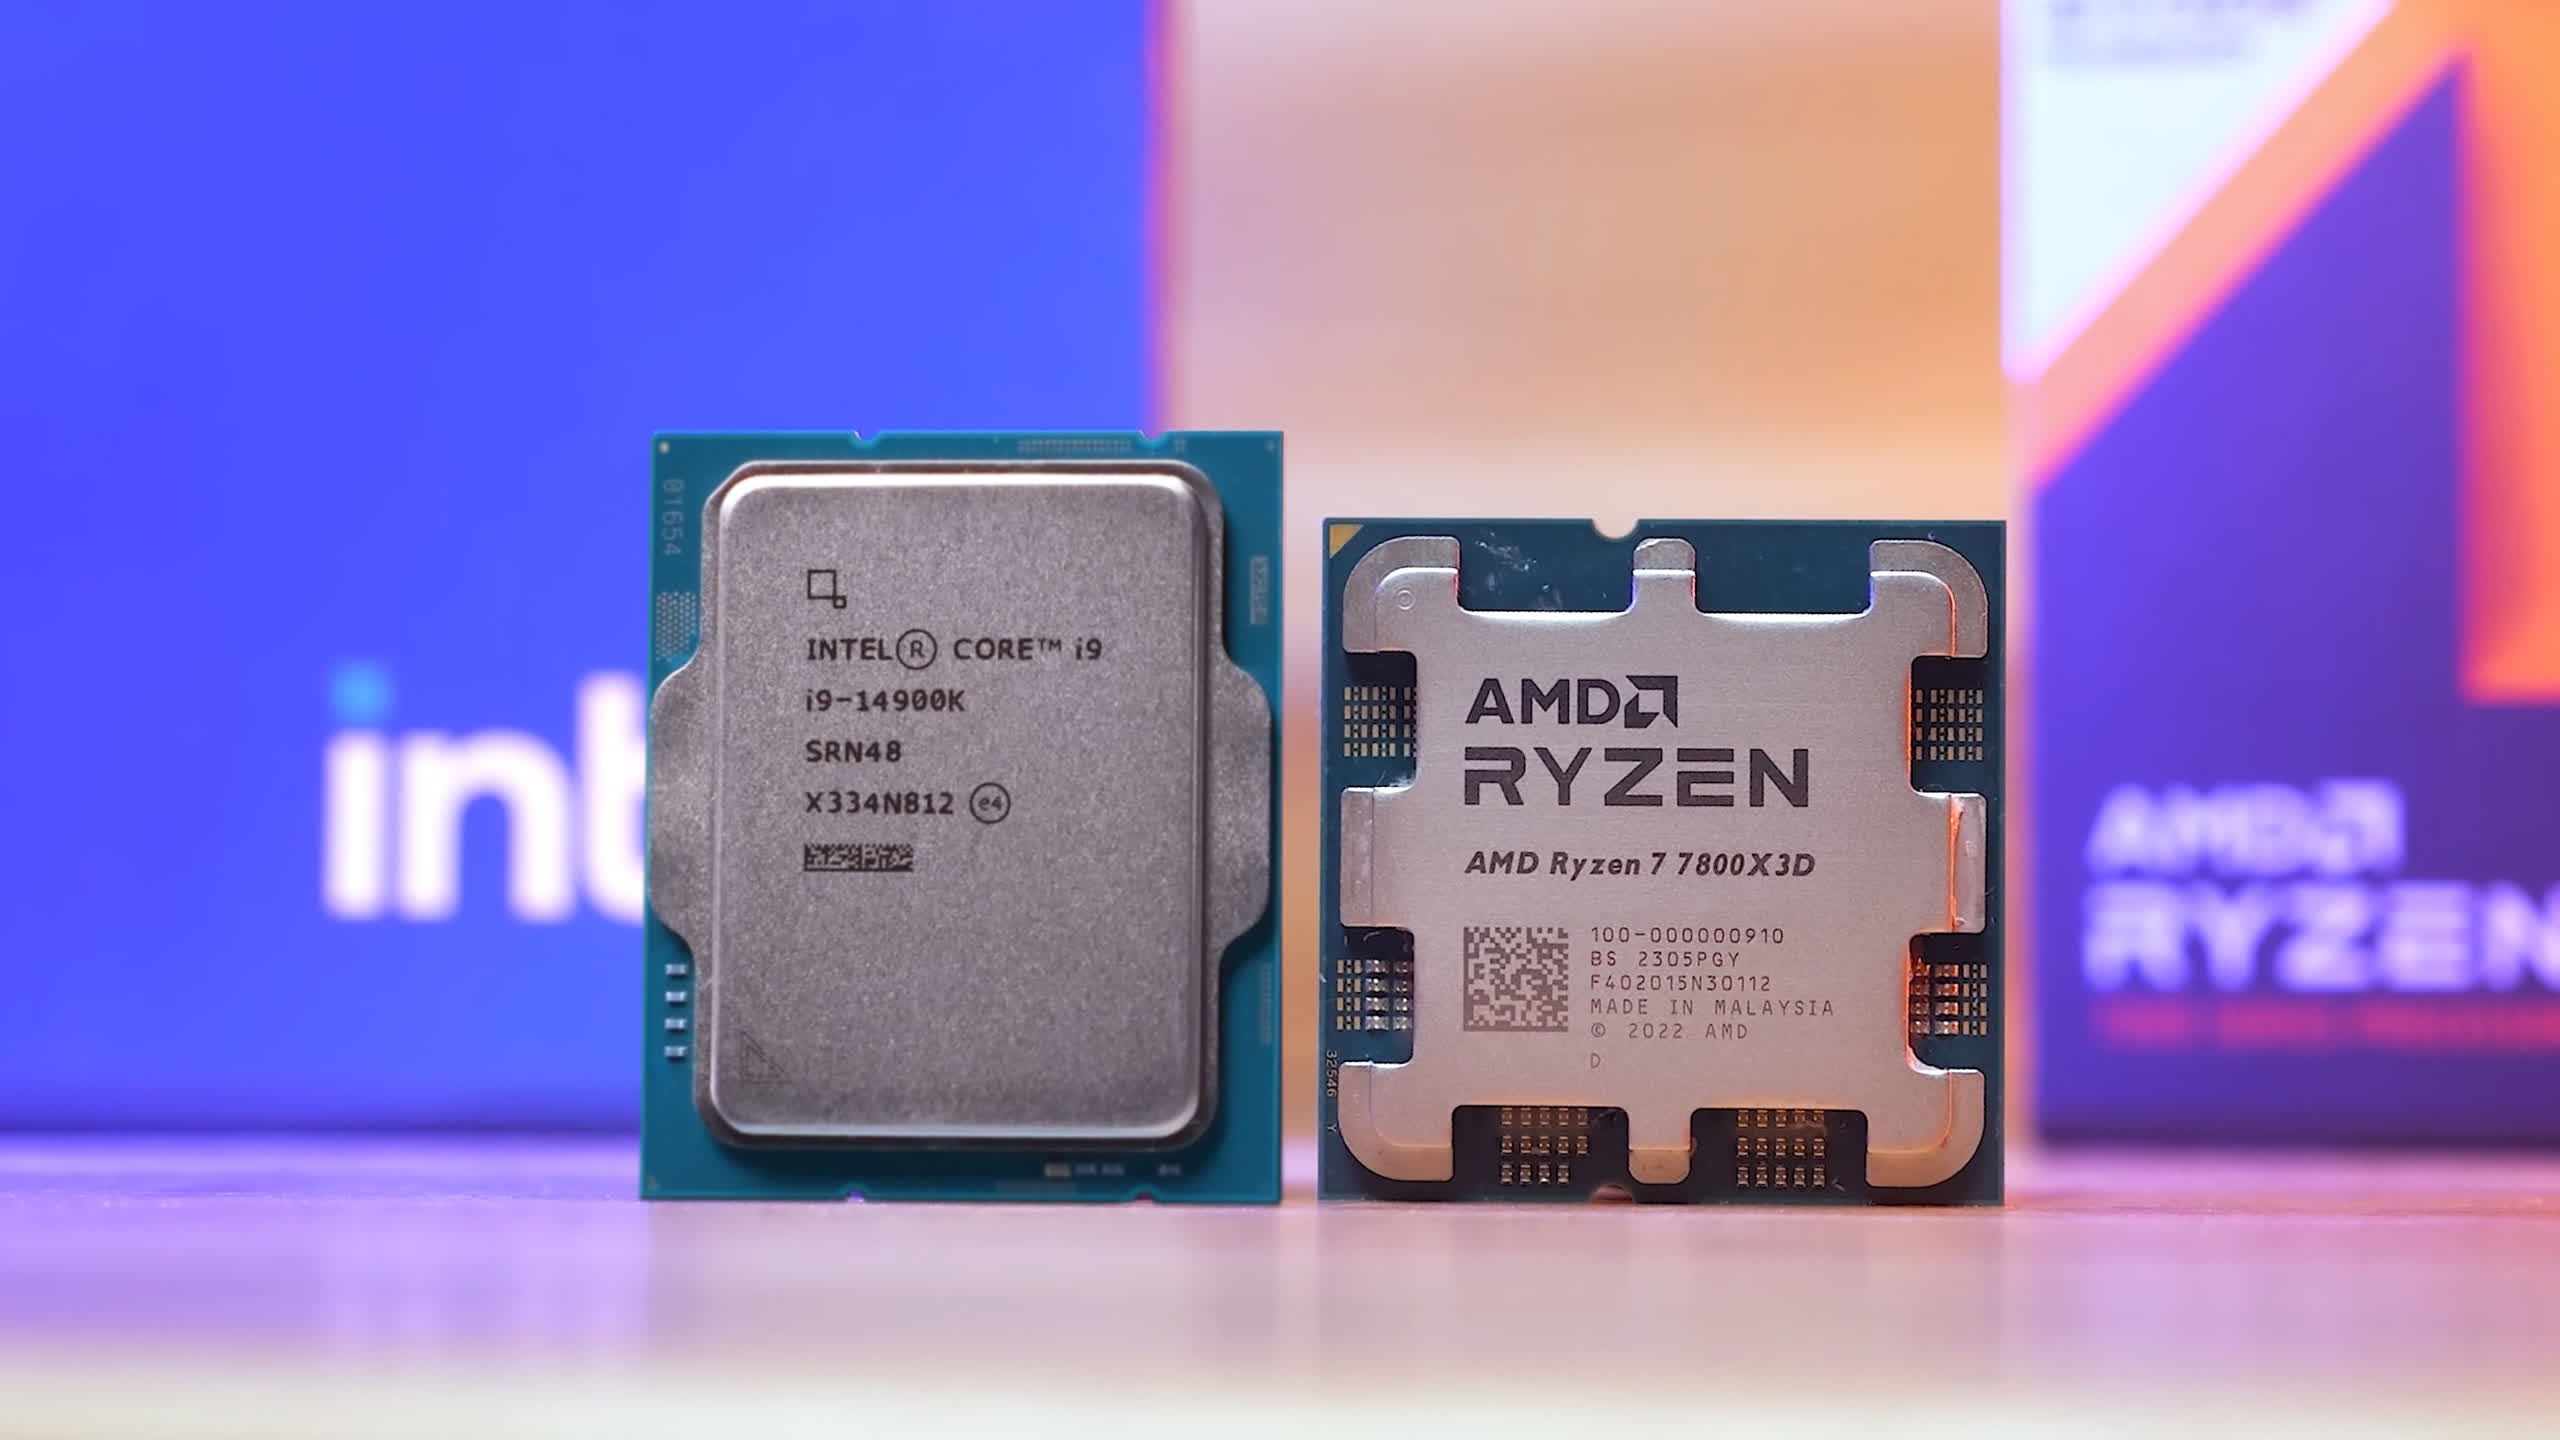
We’re going to assume that at this point you’re aware of the stability issues Intel and its partners have run into with some 13th and 14th-gen processors, primarily the Core i9-13900K and 14900K. The simplest explanation we can provide is this: Intel doesn’t clearly communicate to its partners what the default operating specifications are for their CPUs. Instead, they provide a series of guidelines, but even then, those are just guidelines. In reality, board makers have been free to do whatever they want, and indeed, they have.
Unlike AMD, Intel doesn’t certify motherboards, despite having their logo on the box. With no enforced specifications, whether for power limits or even safety settings, the entire platform has become a bit of a mess. We recently spoke with several of Intel’s partners, which gave us great insight into the issue. A number of engineers were all too happy to share details.
We’ve started to get a good idea of what’s happened and how Intel intends on tackling it, or rather deflecting any blame. We’ve also started to see a number of BIOS updates rolled out for LGA 1700 motherboards. However, despite Intel promising users this mess would be addressed by the end of May, that never really happened.
Intel’s Power Profiles Clarified
That said, we have at least received some clarification on what board partners will be implementing moving forward. It seems that the Core i9 parts, such as the 13900K and 14900K, will run at 253 watts for PL1 and PL2, despite some Z790 boards running the Intel ‘performance’ profile by default with their latest beta BIOS revisions. The performance profile will reduce the long-duration power limit to just 125 watts, which isn’t great and results in around a 15% performance loss for core-heavy workloads when compared to 253 watts.
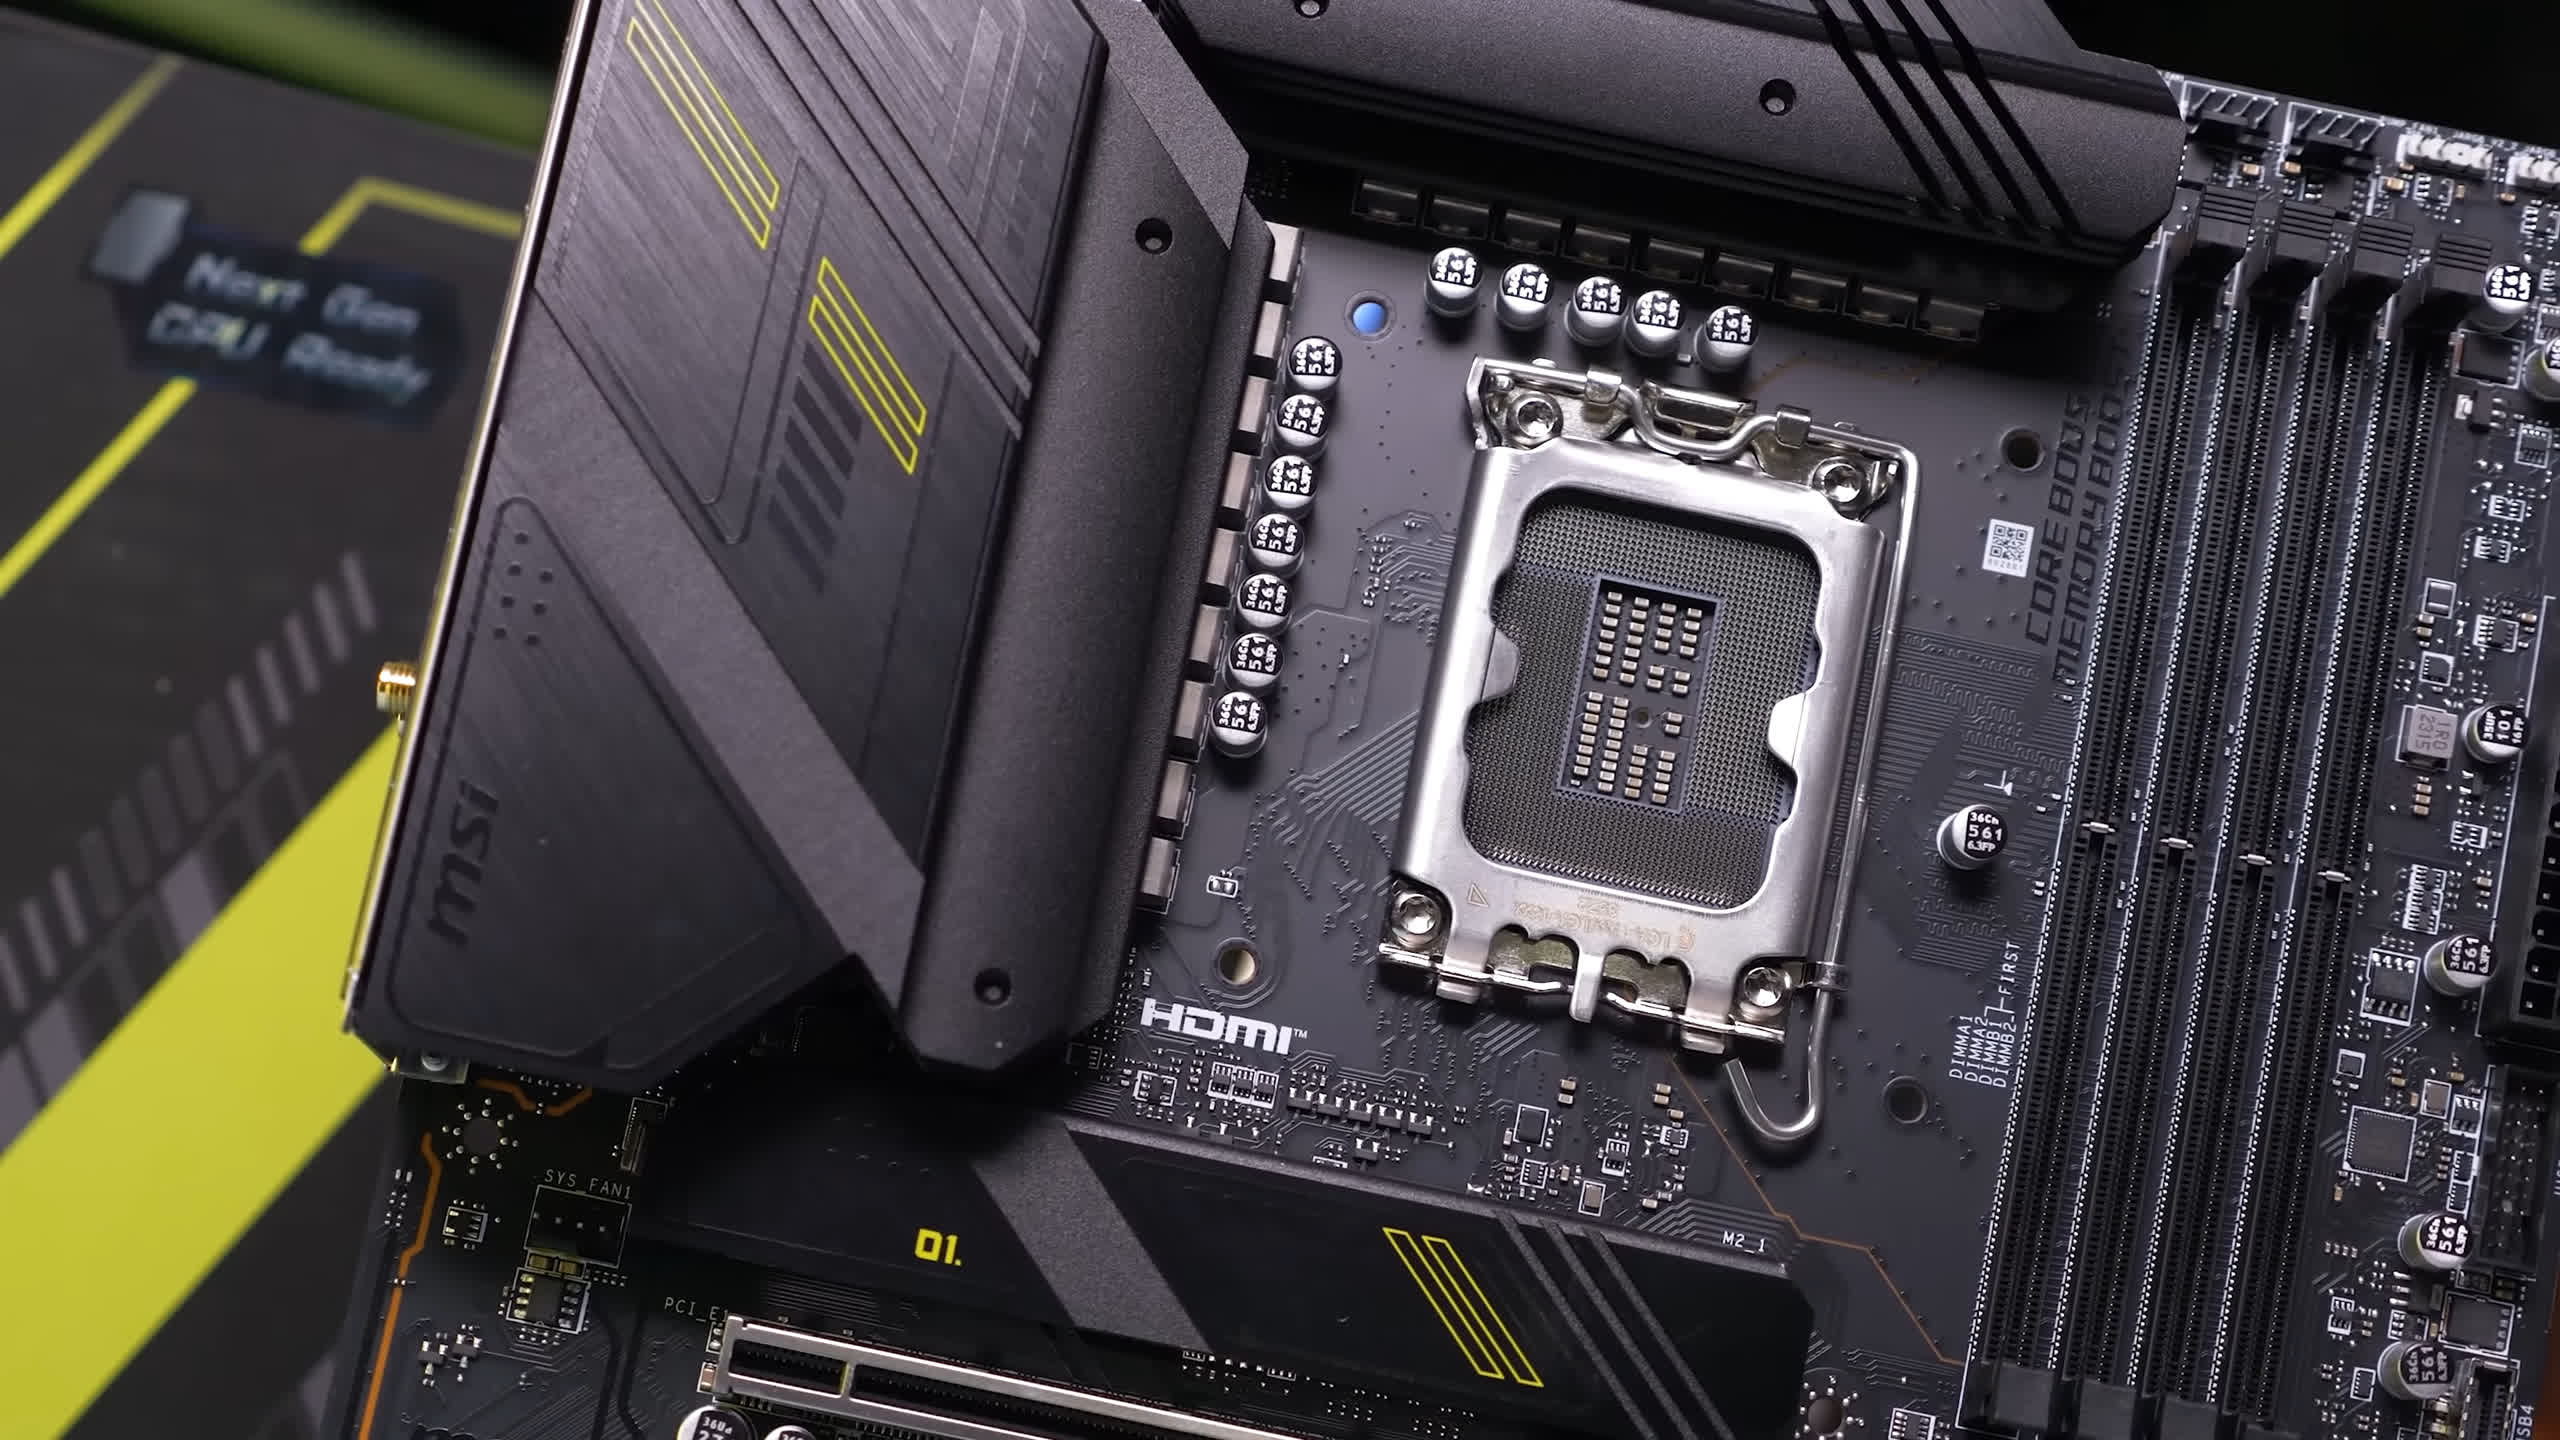
Intel has communicated to board partners that setting PL1 to 125 watts is what they call “standard,” while 253 watts is “recommended.” Initially, MSI went with 125 watts for their default profile. At the time of writing this article, that’s still the case, but they tell us they will be opting for the recommended 253 watts in a future BIOS update.
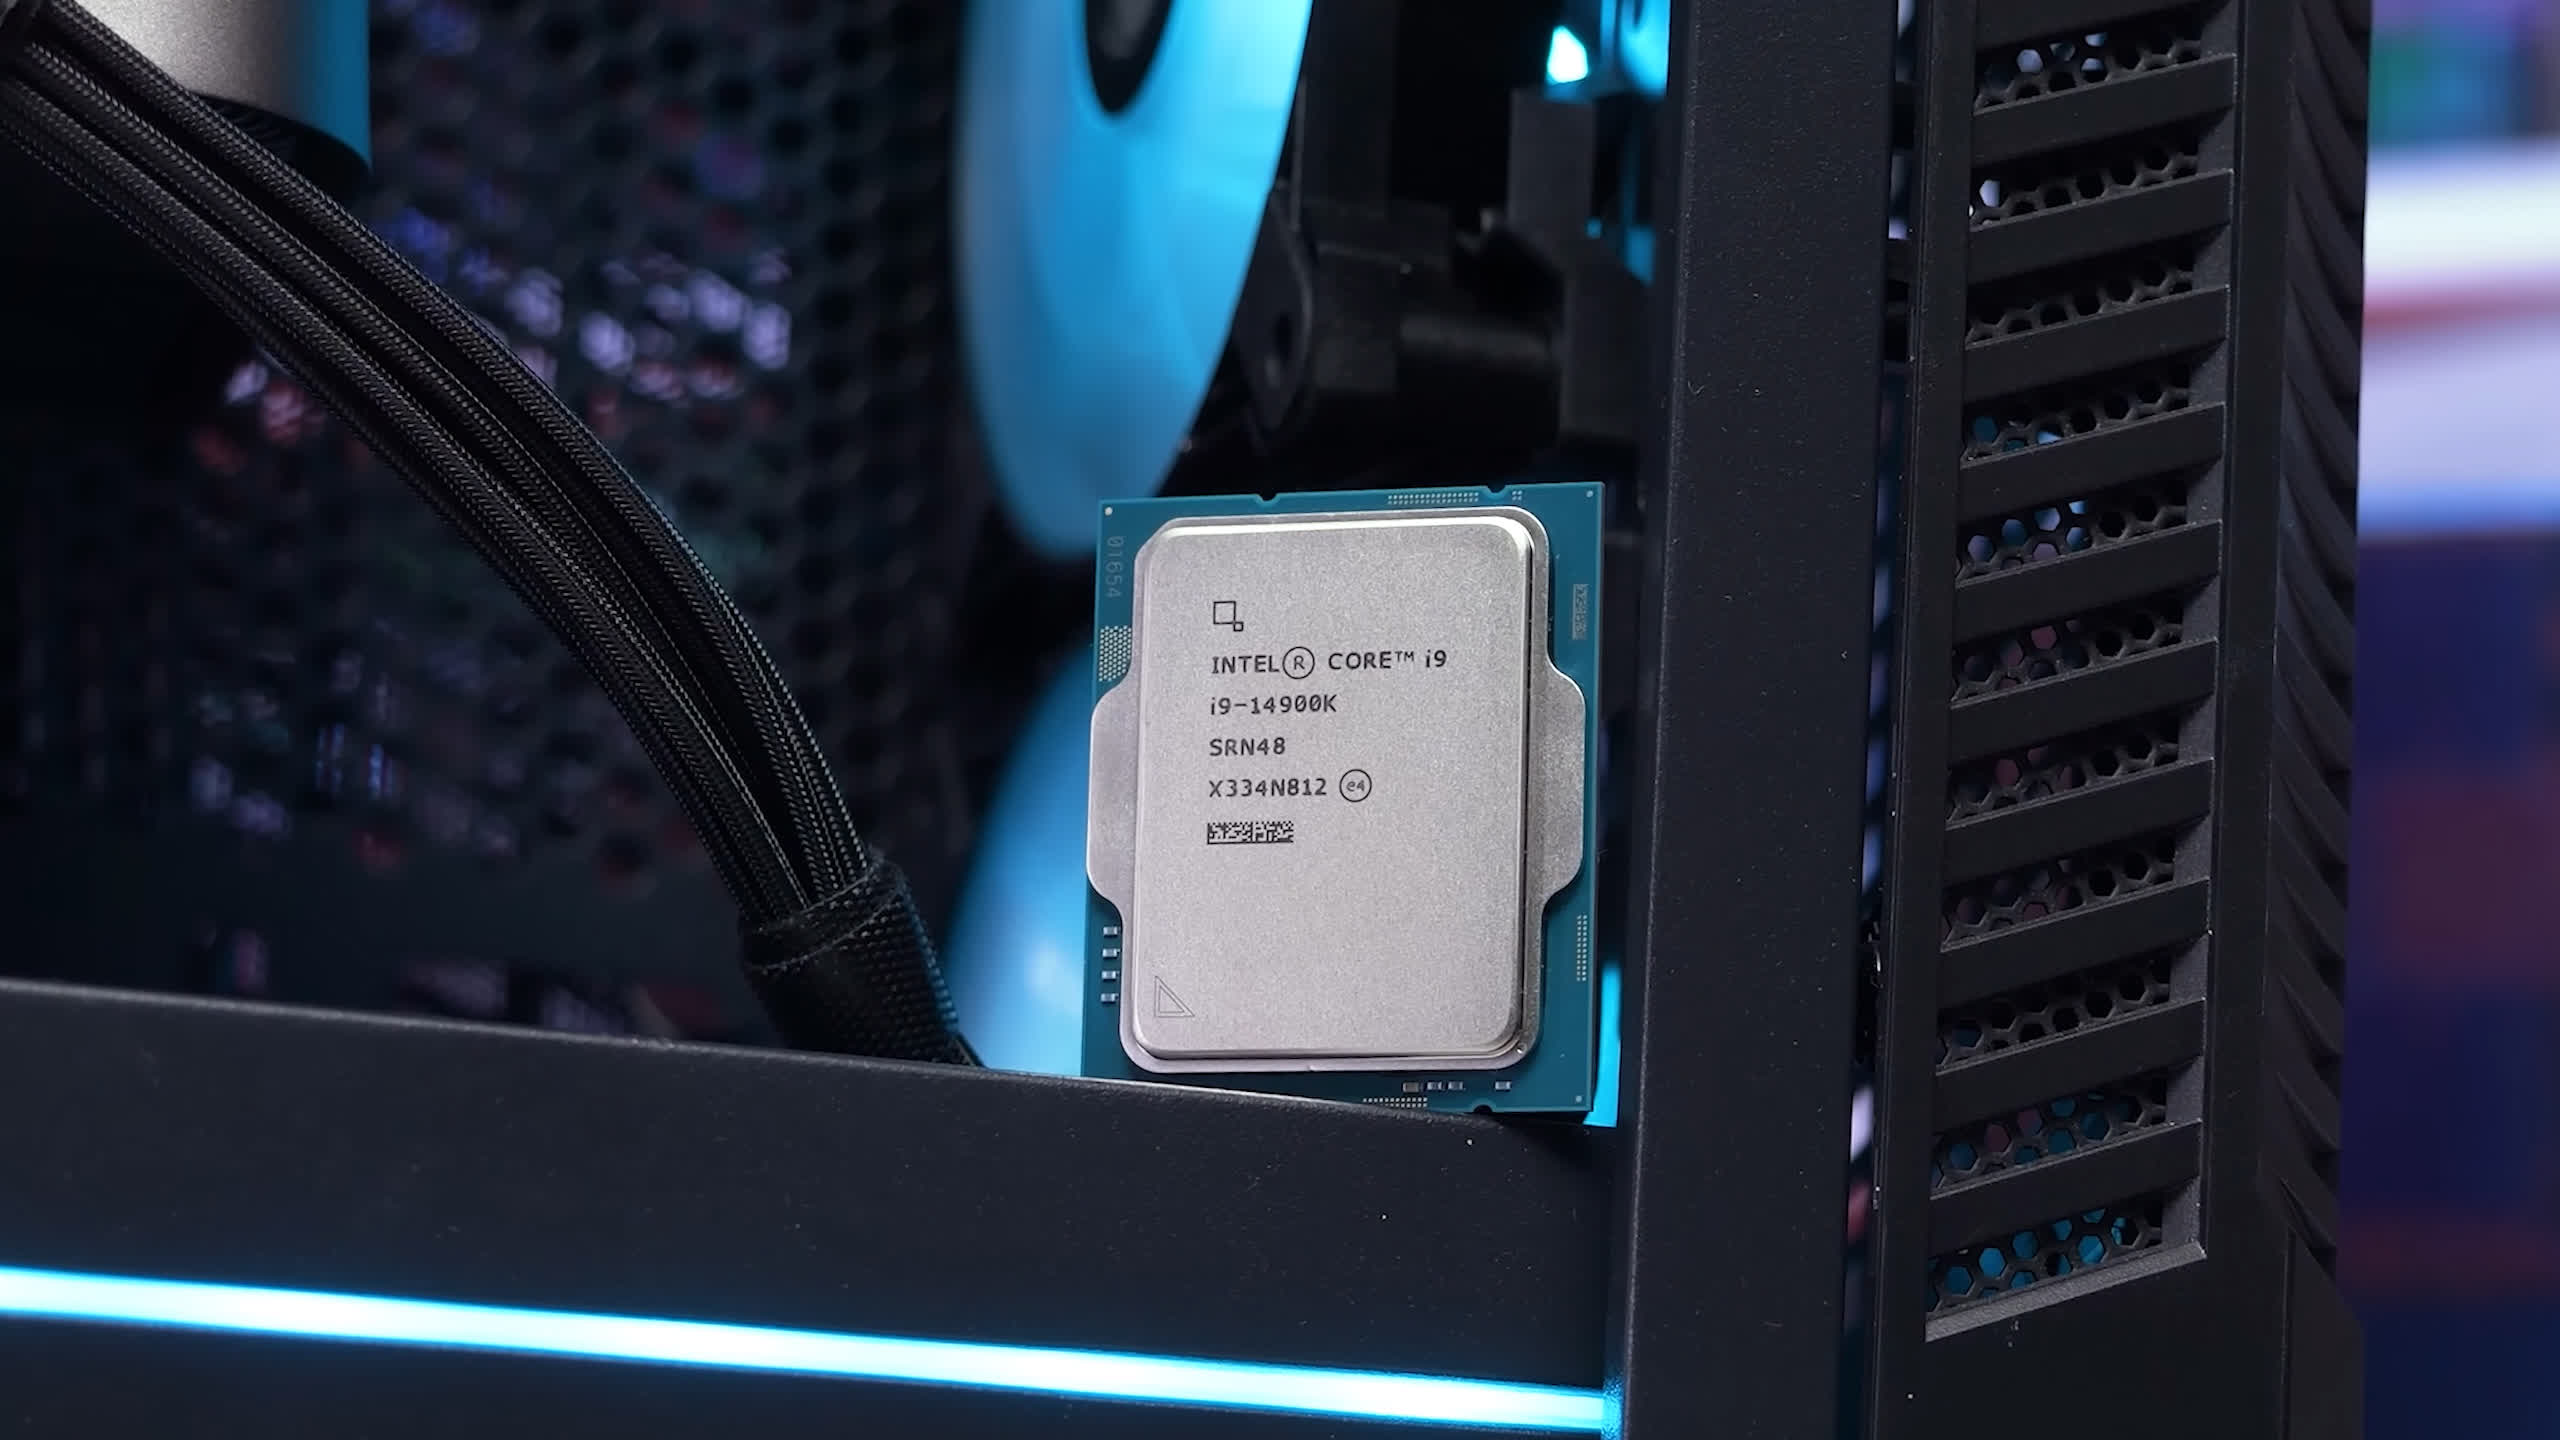
So, months later, we finally have some power profiles from Intel, though it’s not entirely clear how they will be implemented yet. Therefore, we’ve decided to benchmark the gaming performance of both the “performance” and “extreme” profiles using the Core i9-14900K and compare that data with the Ryzen 7 7800X3D.
About a month ago, we did a similar test, but at the time it was unclear what was going to happen. We didn’t test the performance profile as that wasn’t a thing at the time; we still needed to hear from Intel. Even though our findings at the time were still accurate, we didn’t want to risk confusing readers with outdated information.
This updated version should be it. Regardless of how LGA1700 boards end up being configured, they will likely use either Intel’s performance or extreme profiles.
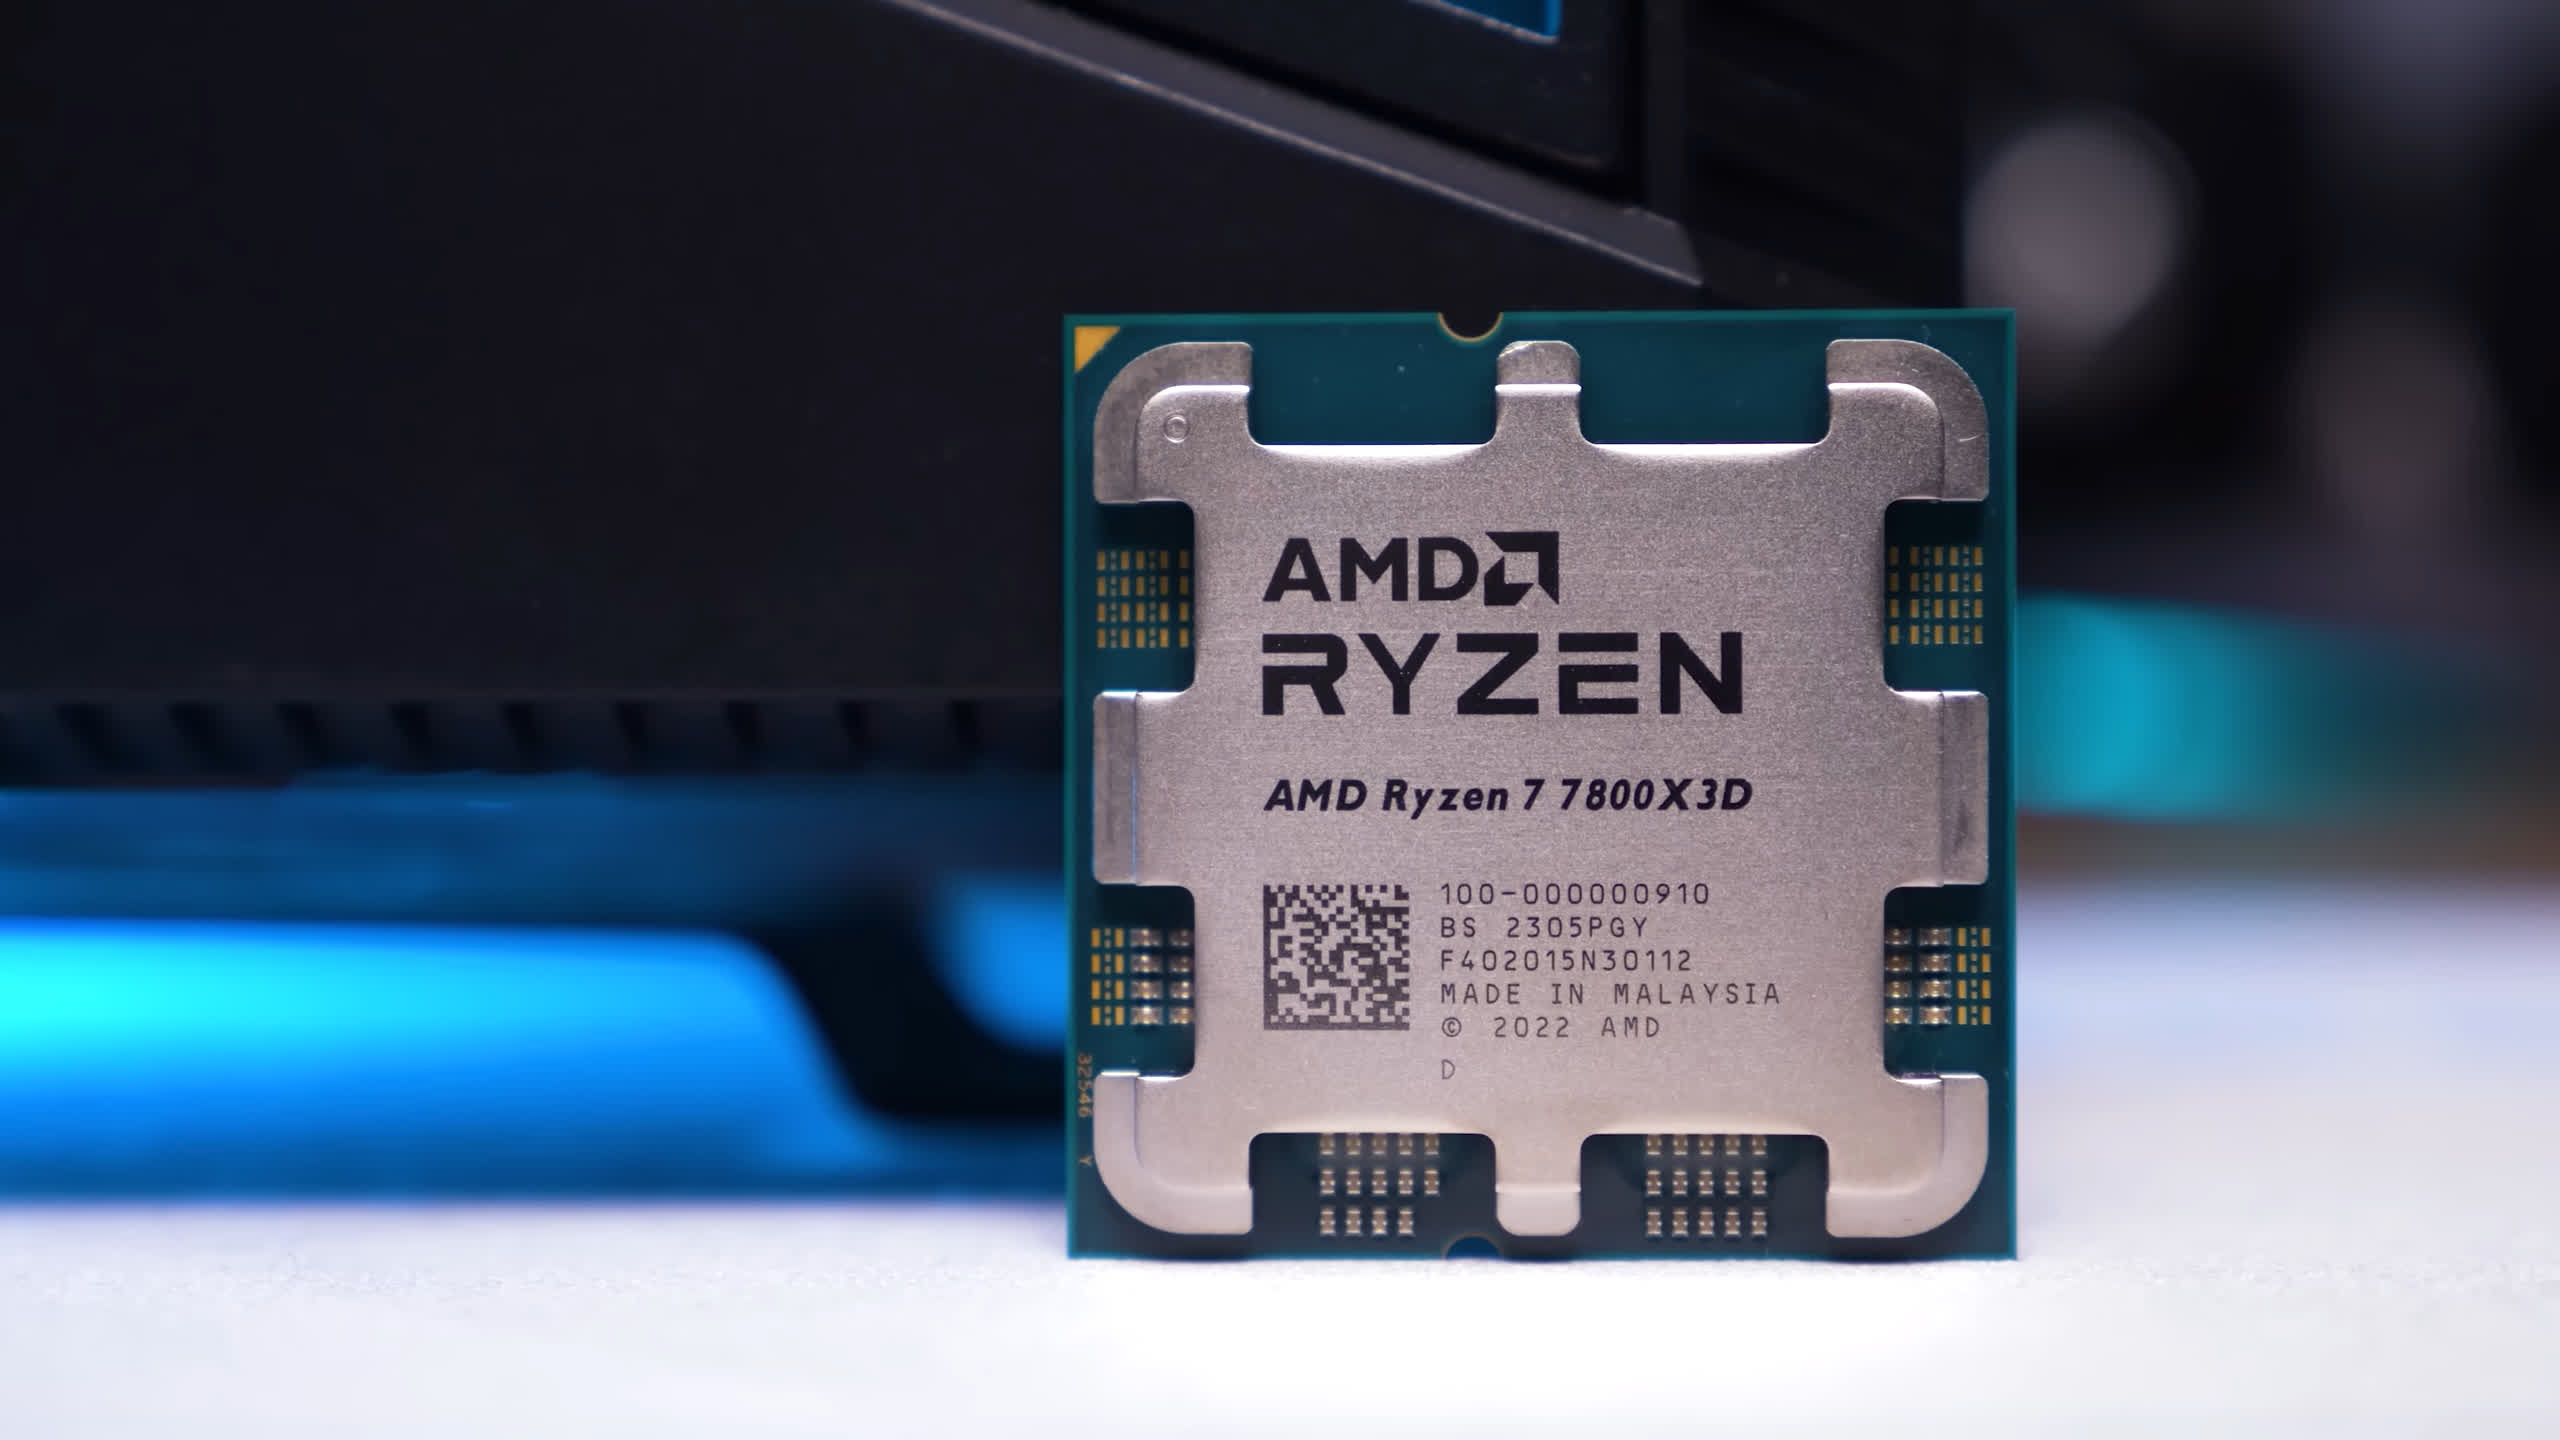
For testing, we’re using the MSI MPG Z790 Carbon WiFi motherboard with BIOS version 7D89v1C2, and the Core i9-14900K will be paired with DDR5-7200 CL34 memory. The Ryzen 7 7800X3D has been paired with 32GB of DDR5-6000 CL30 memory. The reason we’ve gone with faster memory for Intel is that all LGA1700 CPUs we’ve tested appear to work perfectly using 7200 memory, while AM5 processors are limited to DDR5-6000 for optimal performance. This allows for a 1:1 ratio with the memory controller and DRAM, which AMD claims is the ‘sweet spot’ for Zen 4 processors.
Finally, in total, we’ve tested 24 games using the RTX 4090 at 1080p, 1440p, and 4K. We’ll go over the individual data for about half a dozen of the games tested before getting into the breakdown graphs. Let’s now get to it…
Benchmarks
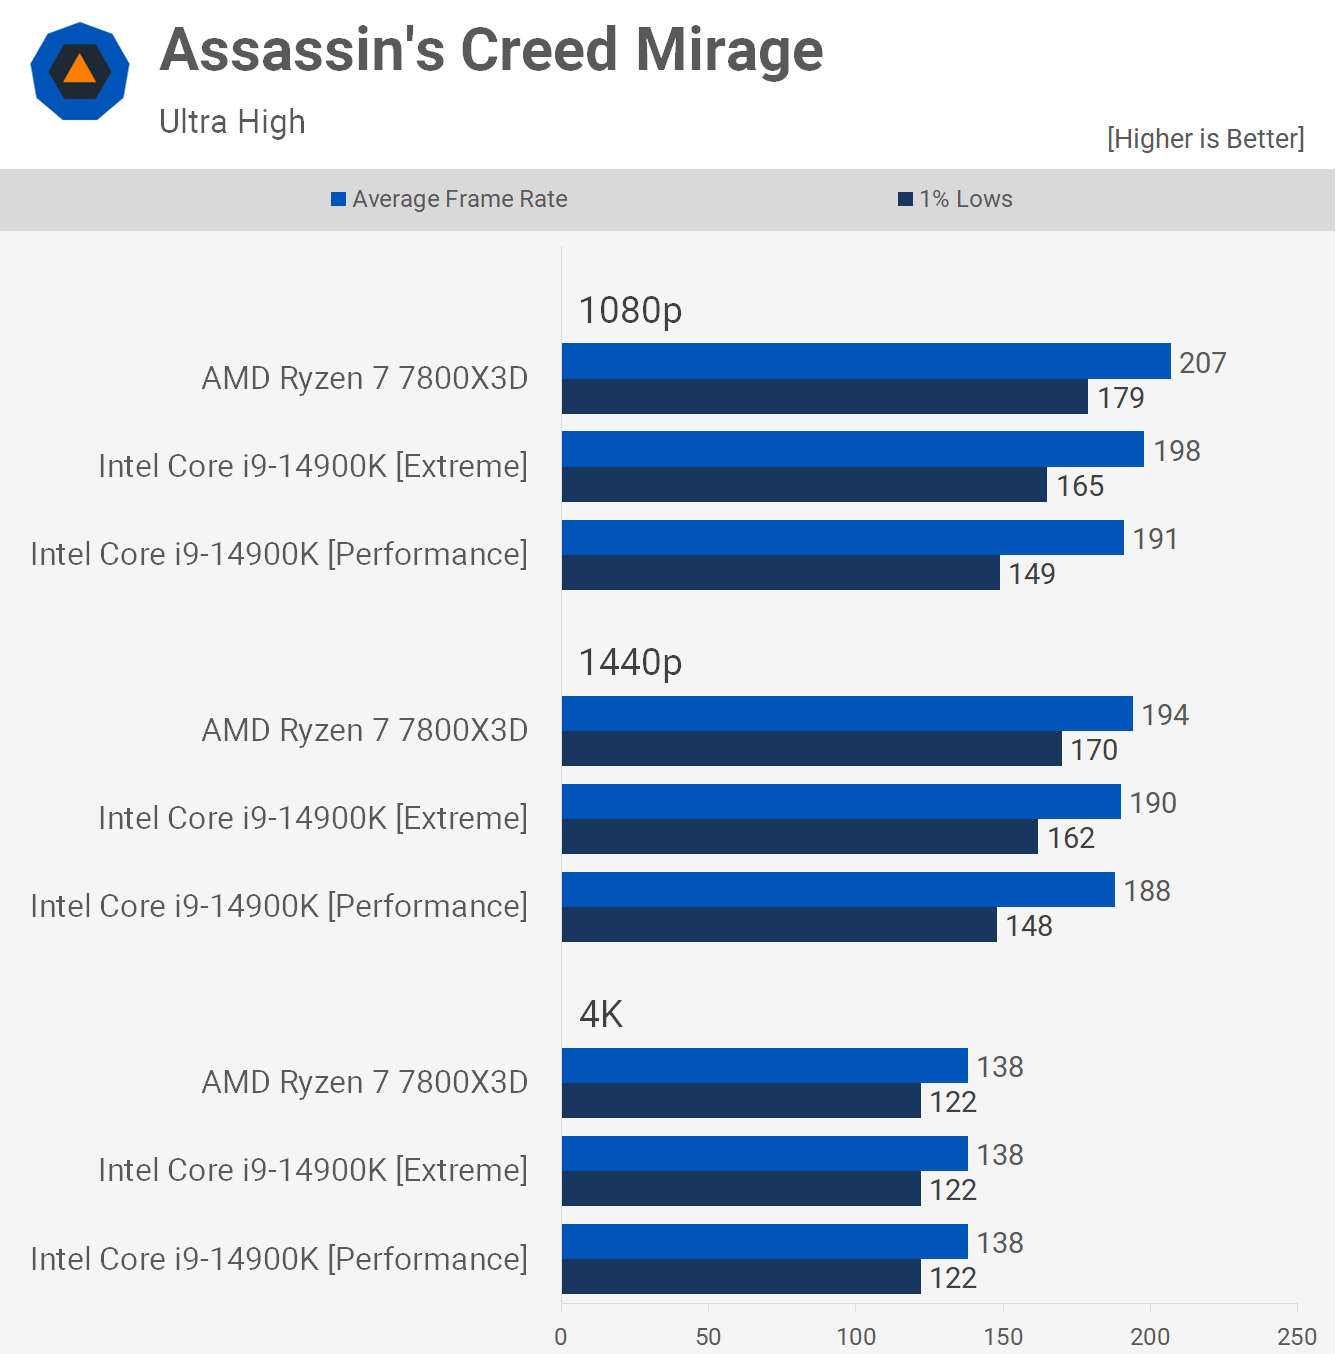
We’ll start by looking at the Assassin’s Creed Mirage results. Here we see that when using the extreme profile, at 253 watts, the 14900K is just 4% slower than the 7800X3D, or 8% slower when looking at the 1% lows.
When using the ‘performance’ profile, the average frame rate of the 14900K drops by a further 4%, but it’s the 1% lows that suffer the biggest hit, dropping by 10%. This means the 7800X3D is on average 8% faster than the power-limited 14900K using the performance profile, and up to 20% faster when comparing 1% lows.
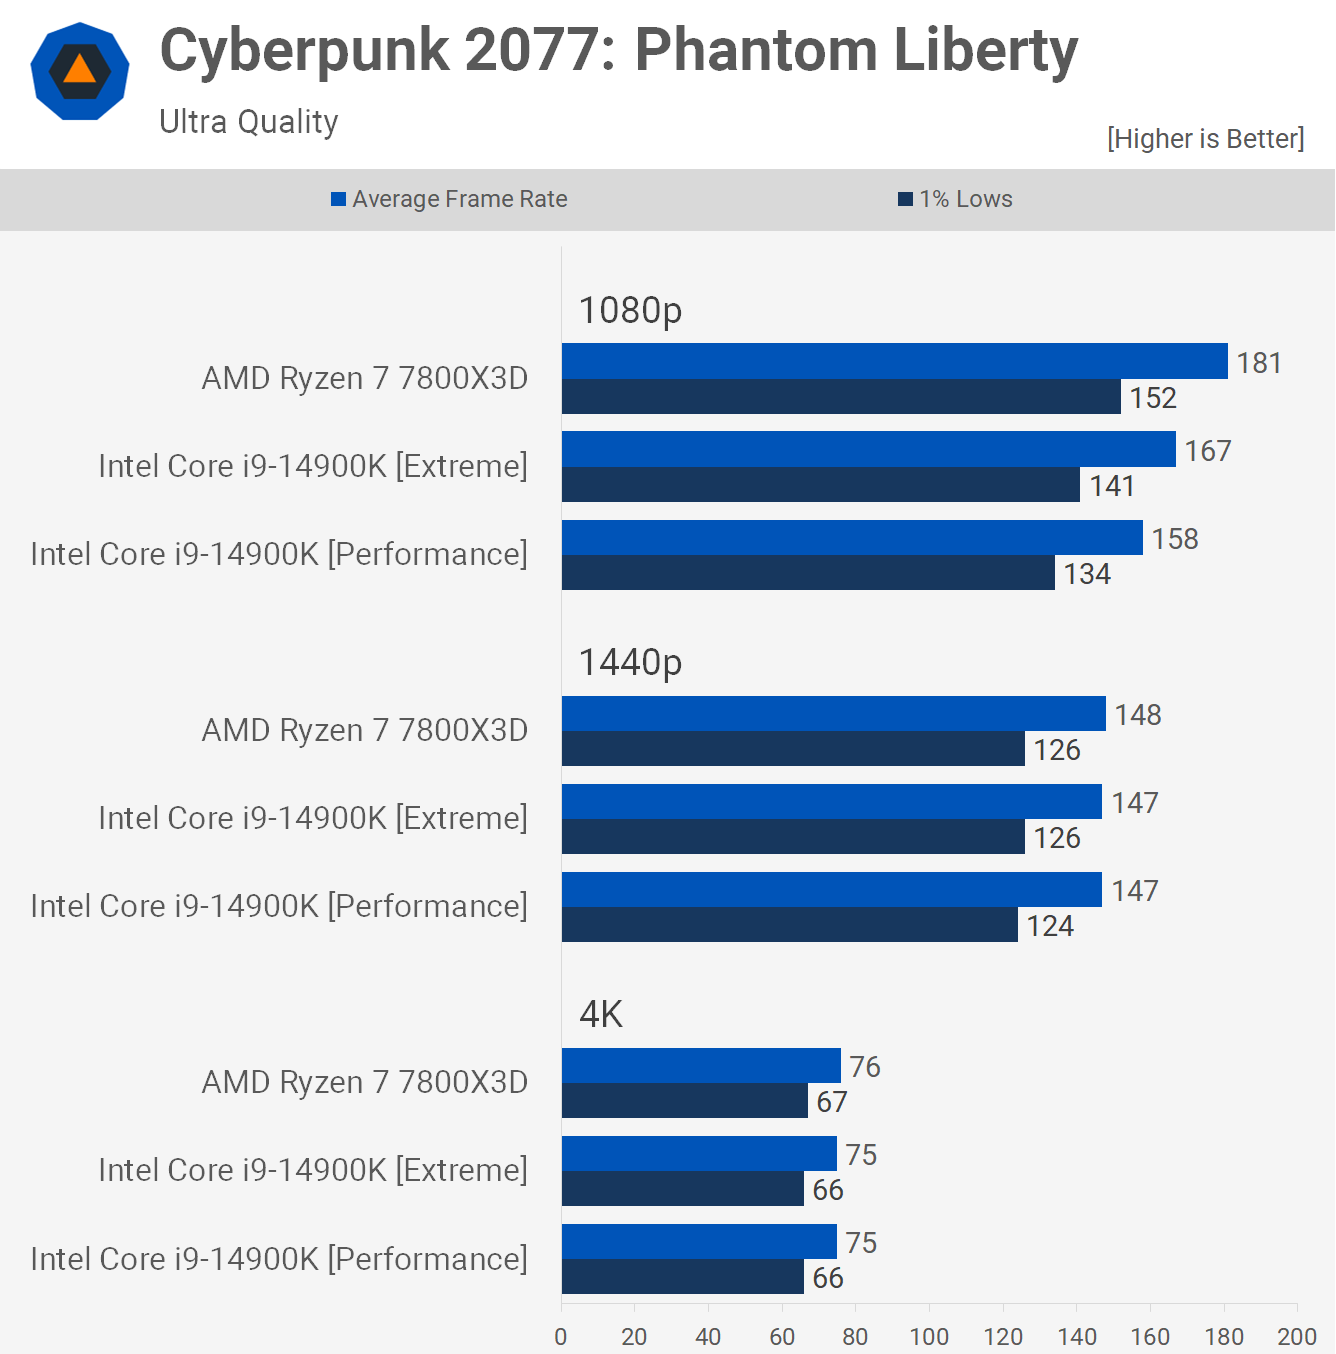
Moving on to Cyberpunk 2077, we find that the 7800X3D is 8% faster than the 14900K using the extreme profile, and 15% faster when limiting the Intel processor to the performance profile. That means we’re seeing around a 5% reduction in performance for the i9 when using the performance profile.
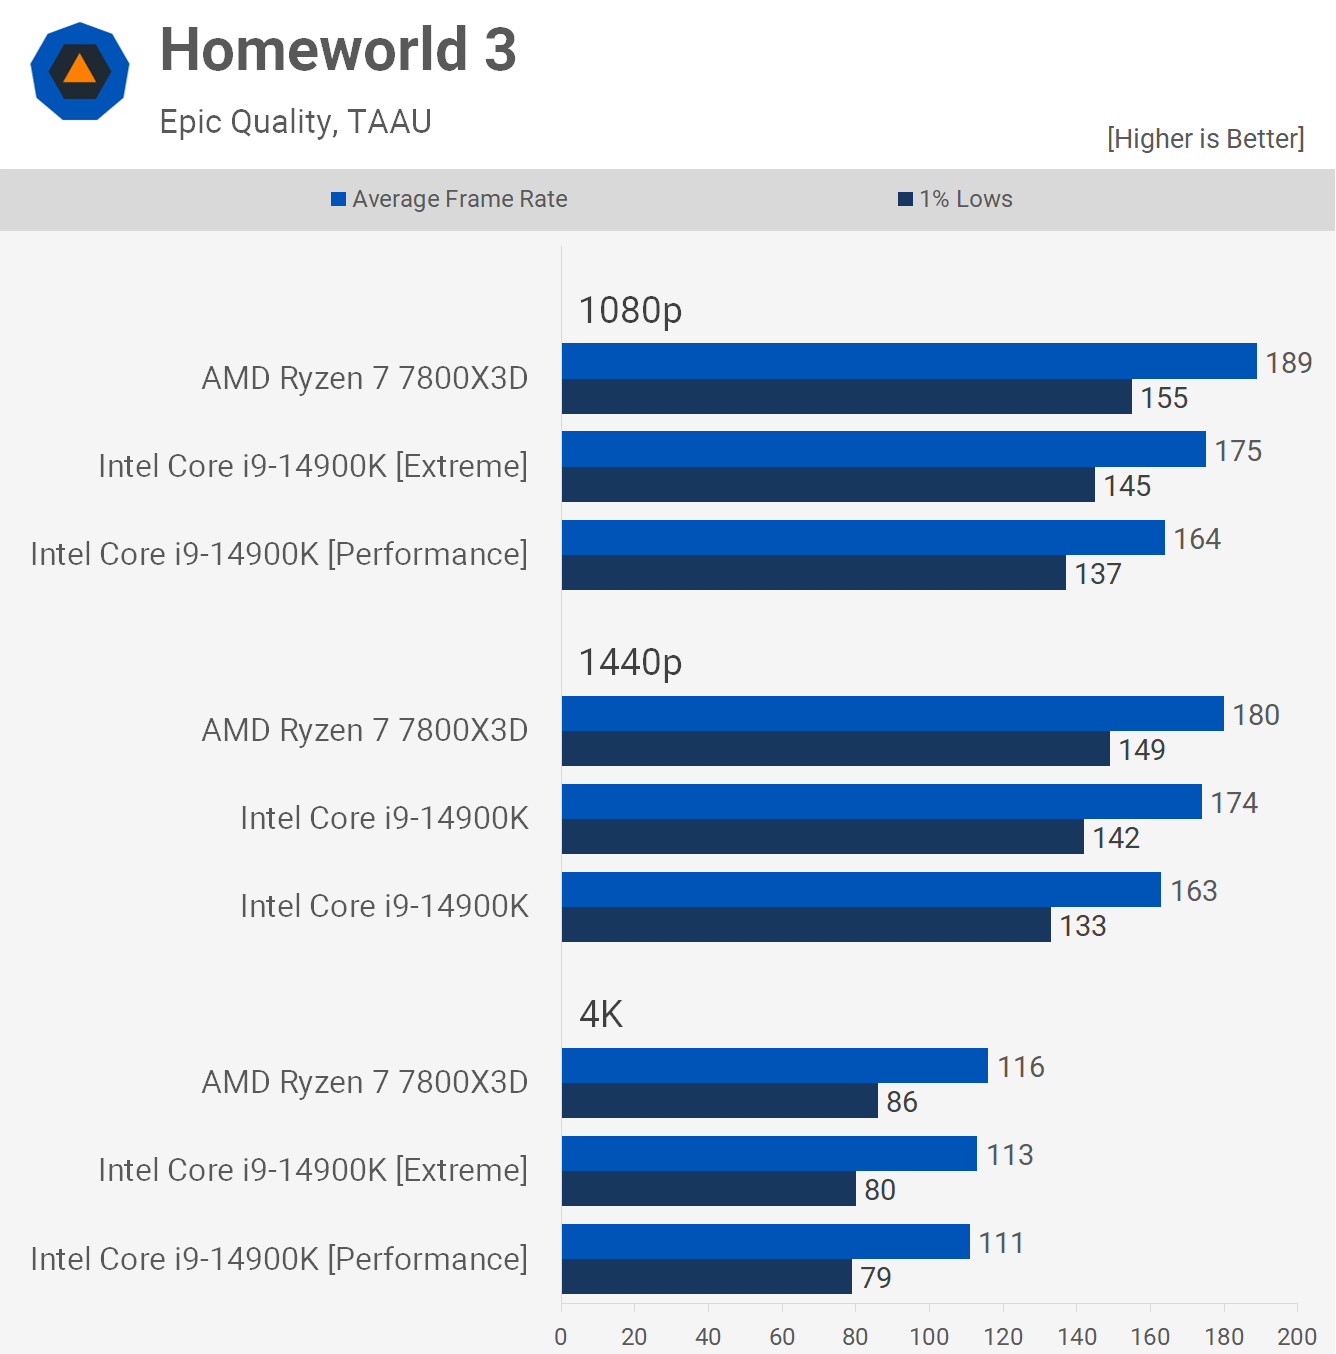
Next up, we have Homeworld 3. Here, the 7800X3D leads the 14900K by an 8% margin, or 15% if we limit the i9 to the performance profile. This means there’s a reasonable 7% uplift from ‘performance’ to ‘extreme’ for the 14900K.
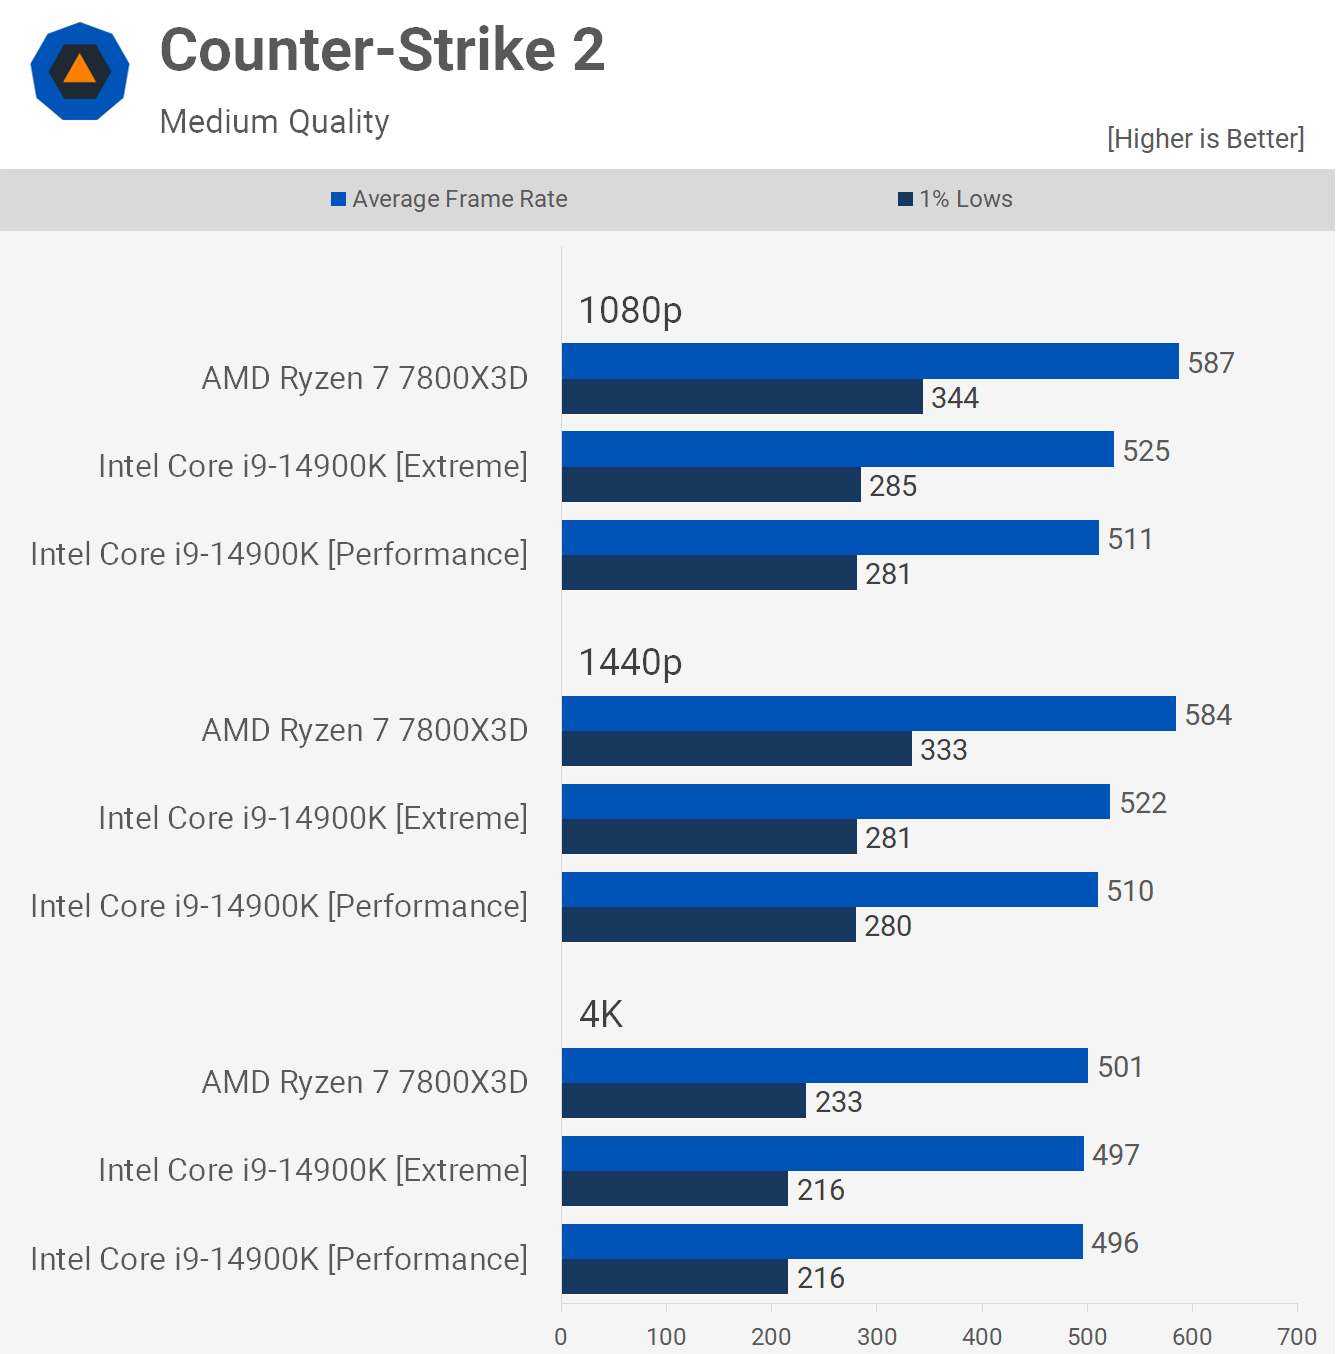
Counter-Strike 2 isn’t a core-heavy title, so the power profiles don’t make much difference here. Running the 14900K using either the performance or extreme models yields the same results, or near enough to the same. That meant the 7800X3D was around 12-15% faster.
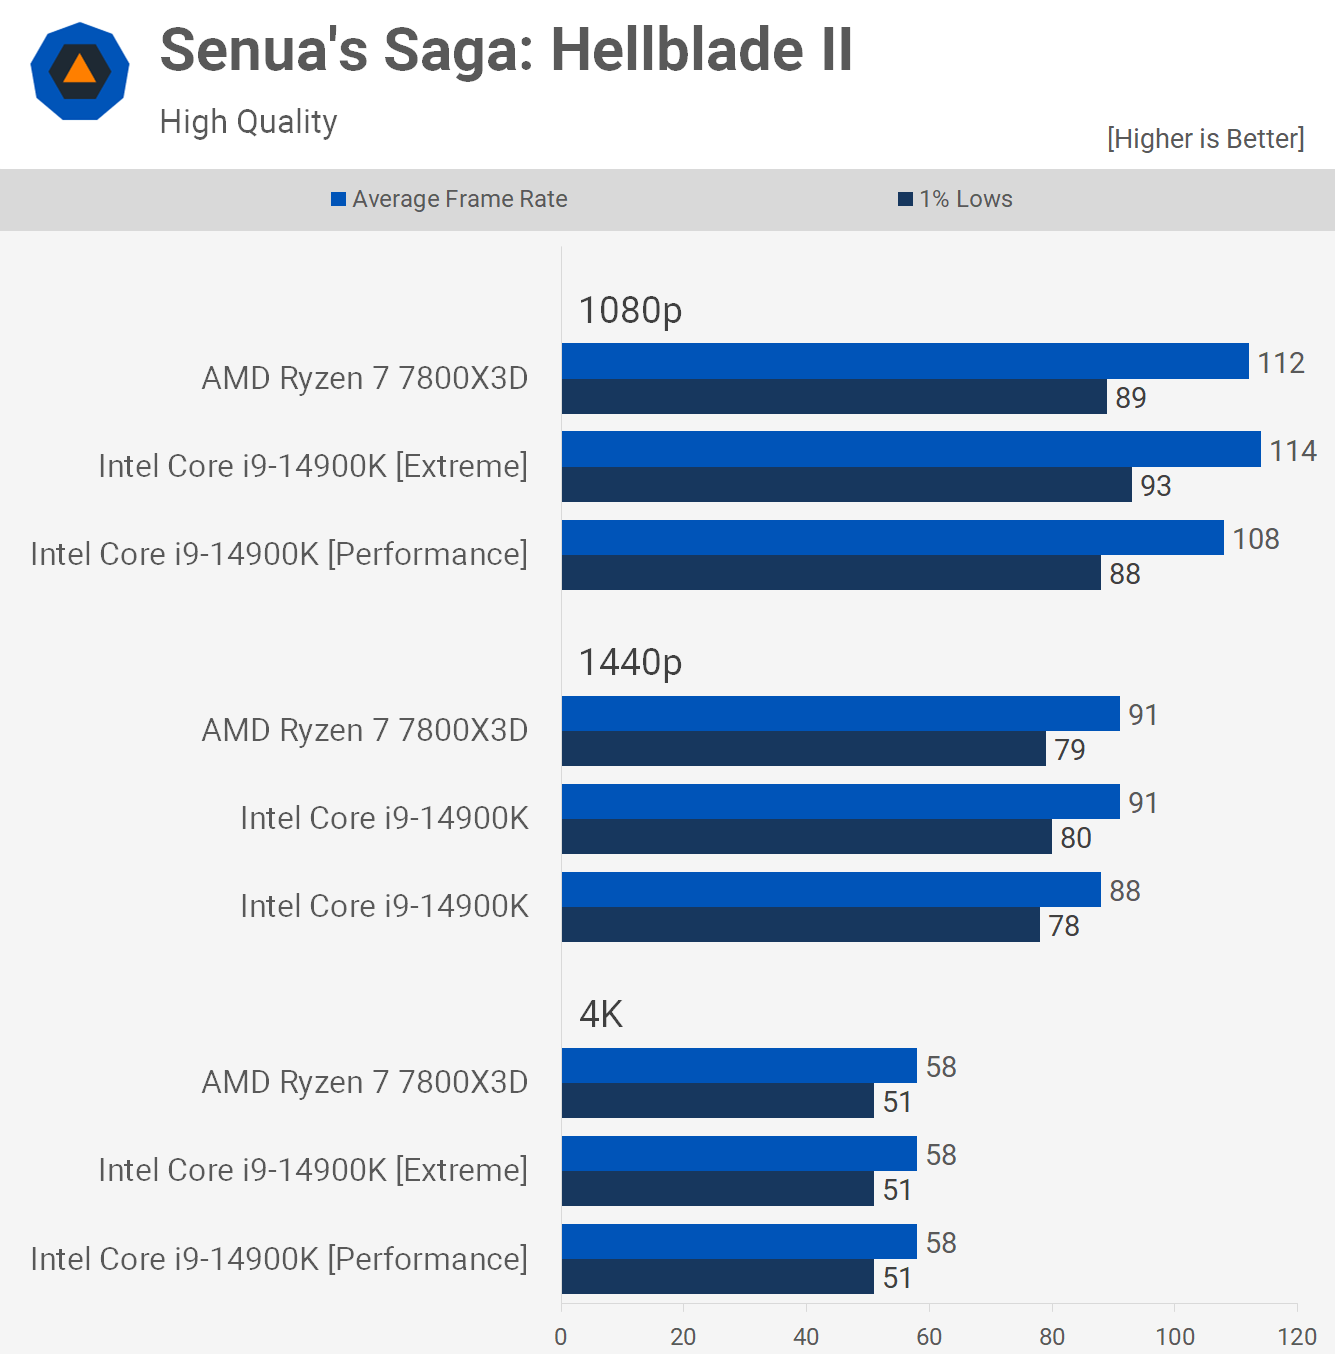
One of the newest games added to our list is Senua’s Saga: Hellblade II. Though this isn’t a game that really tests top-tier CPUs, and as a result, the 7800X3D and 14900K were comparable. The performance profile did drop the 14900K just below the 7800X3D, but we’re only talking about a 5% reduction here.

Horizon Forbidden West is another game that isn’t particularly CPU demanding, at least not with flagship gaming processors. The 7800X3D was just 5% faster than the 14900K, or 6% faster if you limit the Core i9 to the ‘performance’ profile. So overall, very similar performance between these two CPUs, regardless of the power configuration.
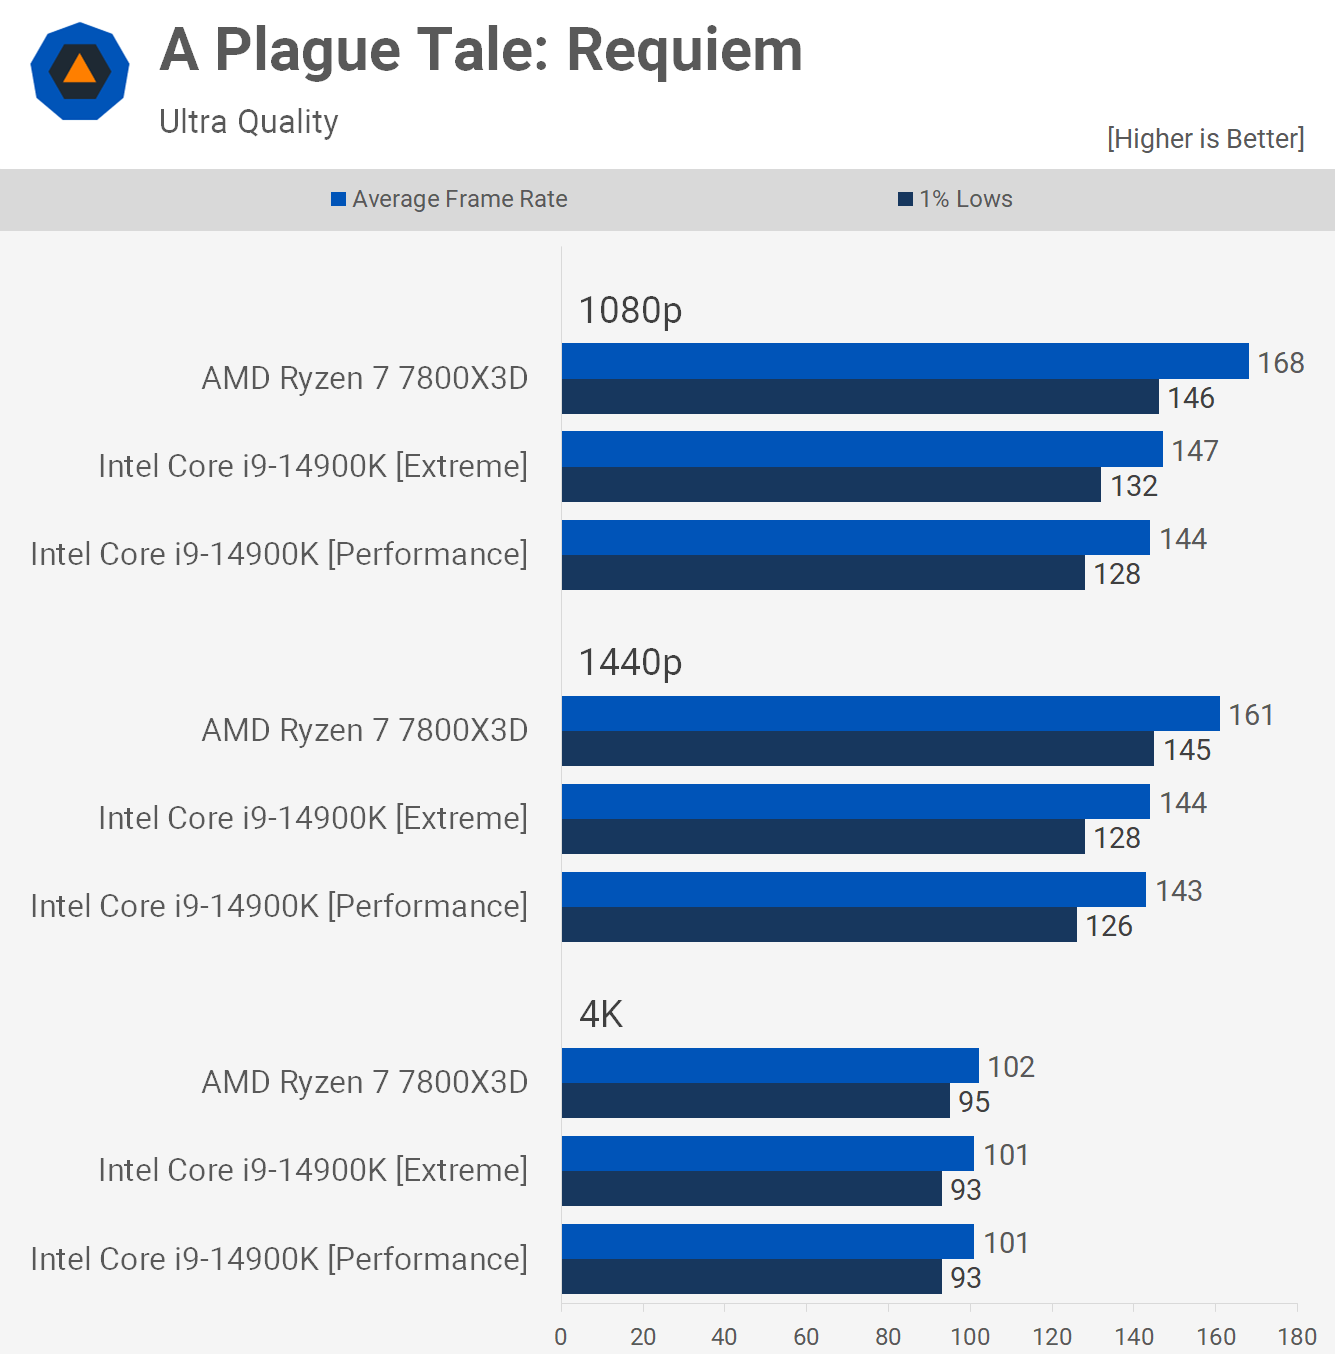
Next up, we have A Plague Tale: Requiem, and this one is easily won by the 7800X3D, delivering up to 14% greater performance at 1080p. We also have another example where the ‘performance’ profile doesn’t hurt performance all that much, with just a 2% hit to the average frame rate.
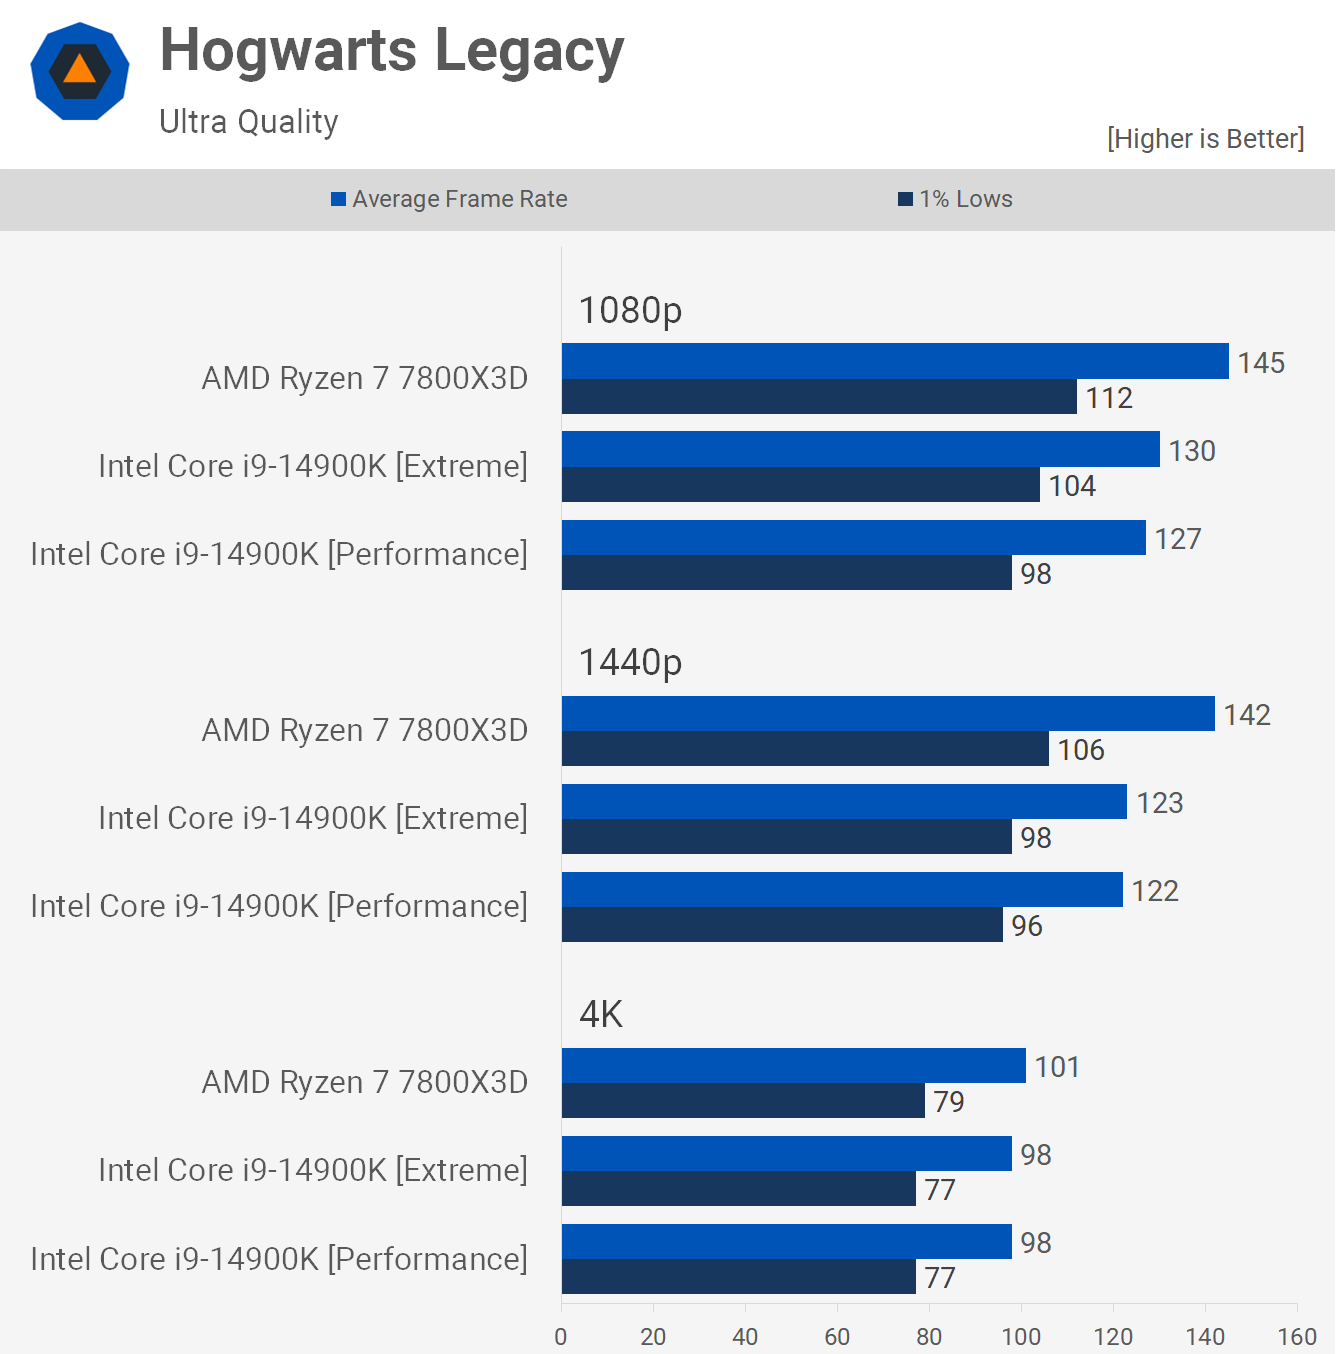
Hogwarts Legacy is another game where the 7800X3D performs very well, this time outpacing the 14900K by a 12% margin. This is also another example where the performance and extreme profiles deliver similar performance, so downgrading the power usage of the 14900K isn’t really an issue here.
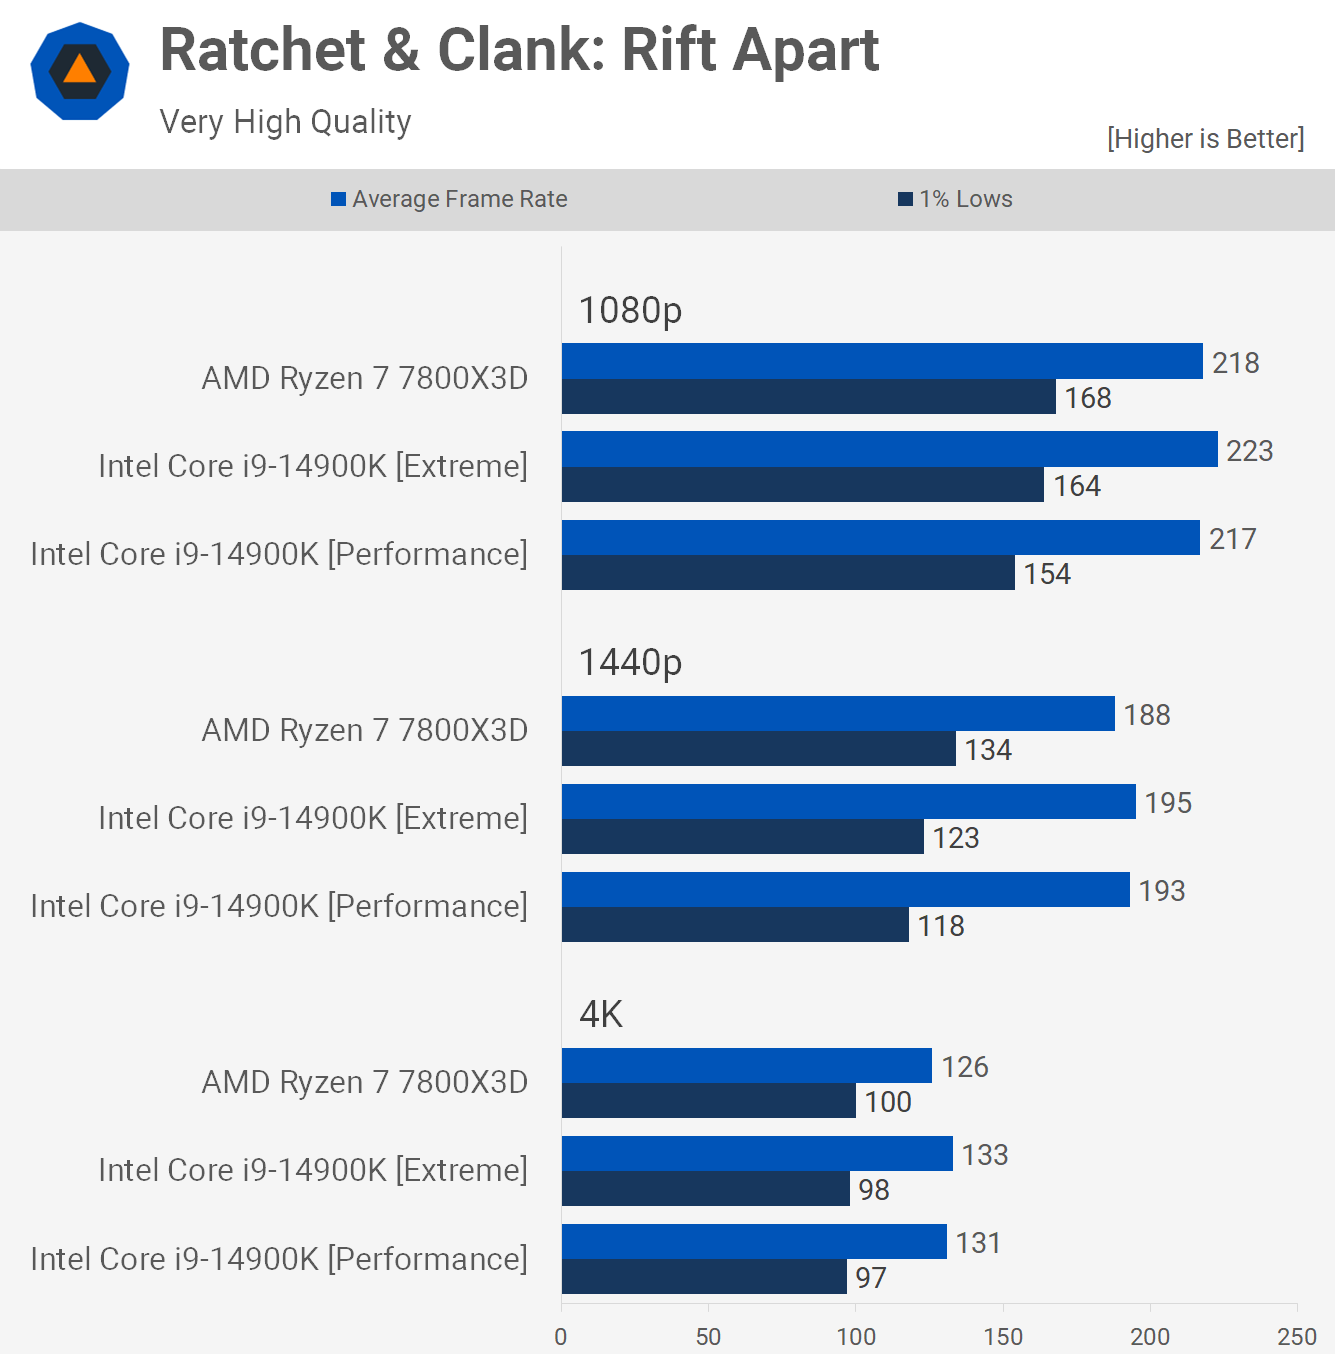
The Ratchet & Clank: Rift Apart performance is very competitive, though we are seeing a hit to the 1% lows of the 14900K when using the ‘performance’ profile, with a 6% drop at 1080p, for example. Overall, though, the 14900K and 7800X3D are comparable in this title.
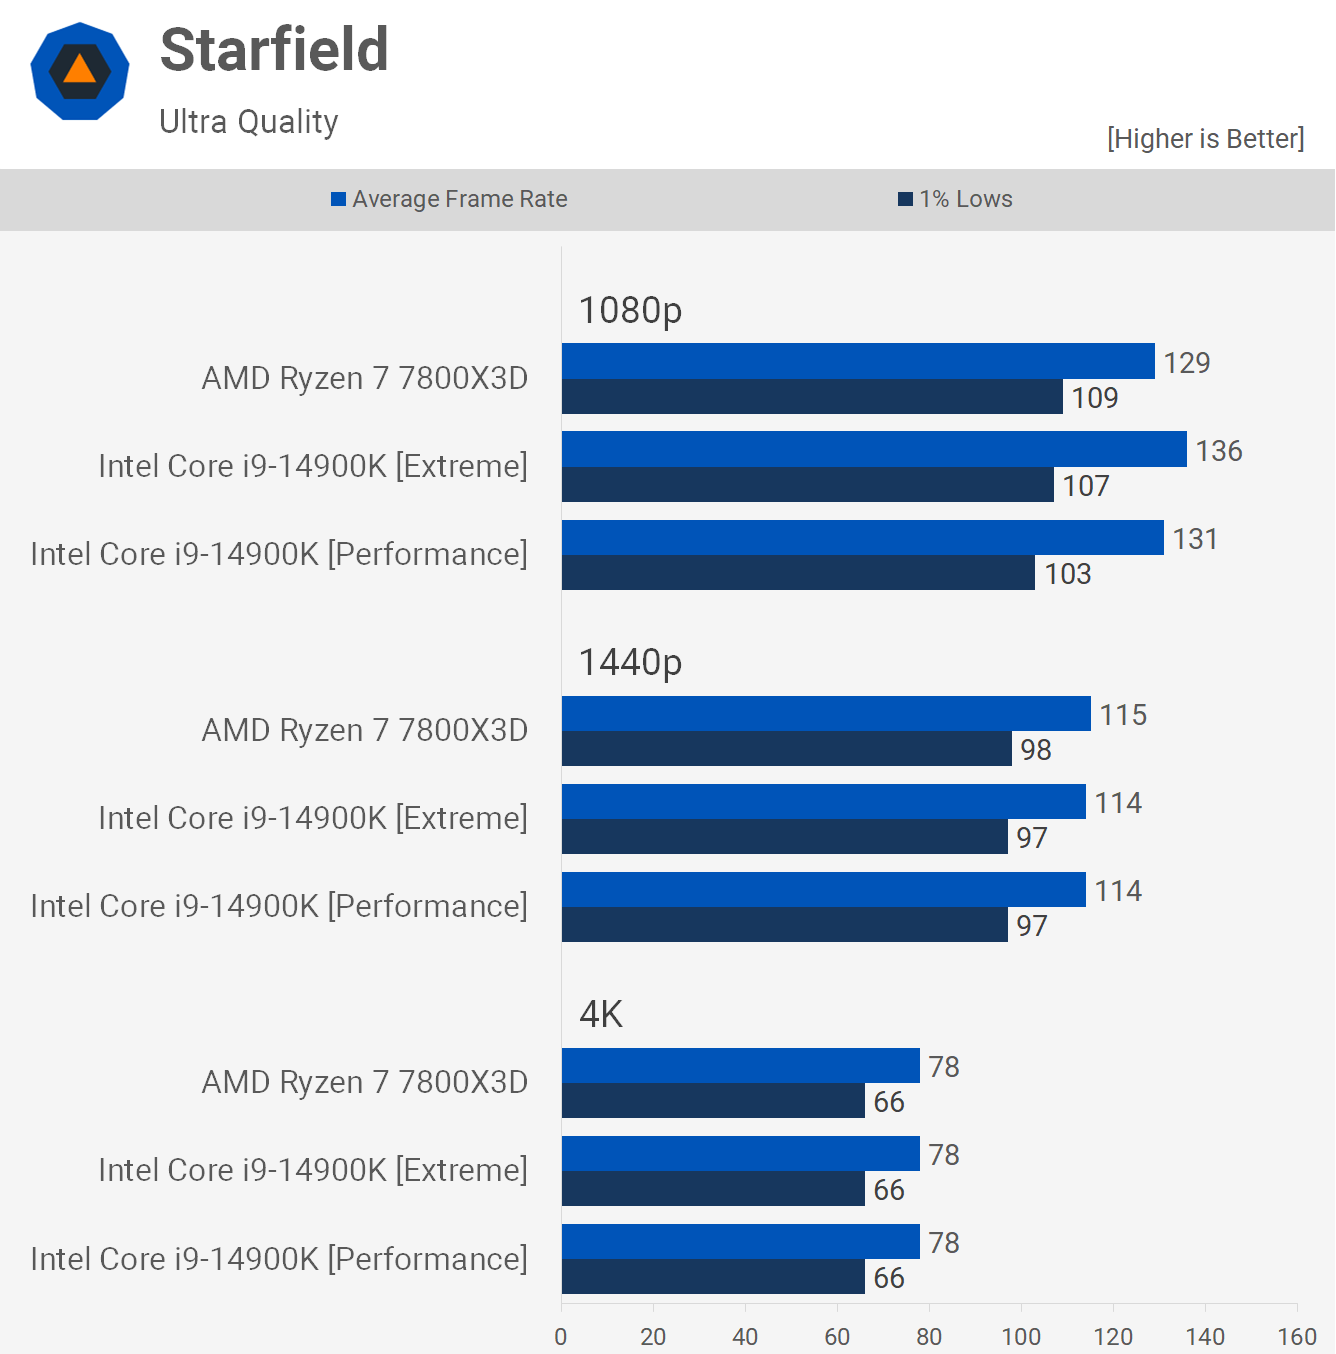
Finally, we have Starfield. This title plays slightly better on the 14900K, at least when looking at the average frame rate. Interestingly, the 7800X3D is able to slightly nudge ahead for the 1% lows, but overall, the experience is very similar.
24 Game Average
Here’s a look at the average performance across the 24 games tested. The 7800X3D was on average 6% faster than the 14900K when running the extreme profile on the Core i9 processor. This margin is fairly typical when testing a wide range of games. If the 14900K is limited to Intel’s ‘performance’ profile, the 7800X3D would be 9% faster on average, or 11% faster when looking at the 1% lows.
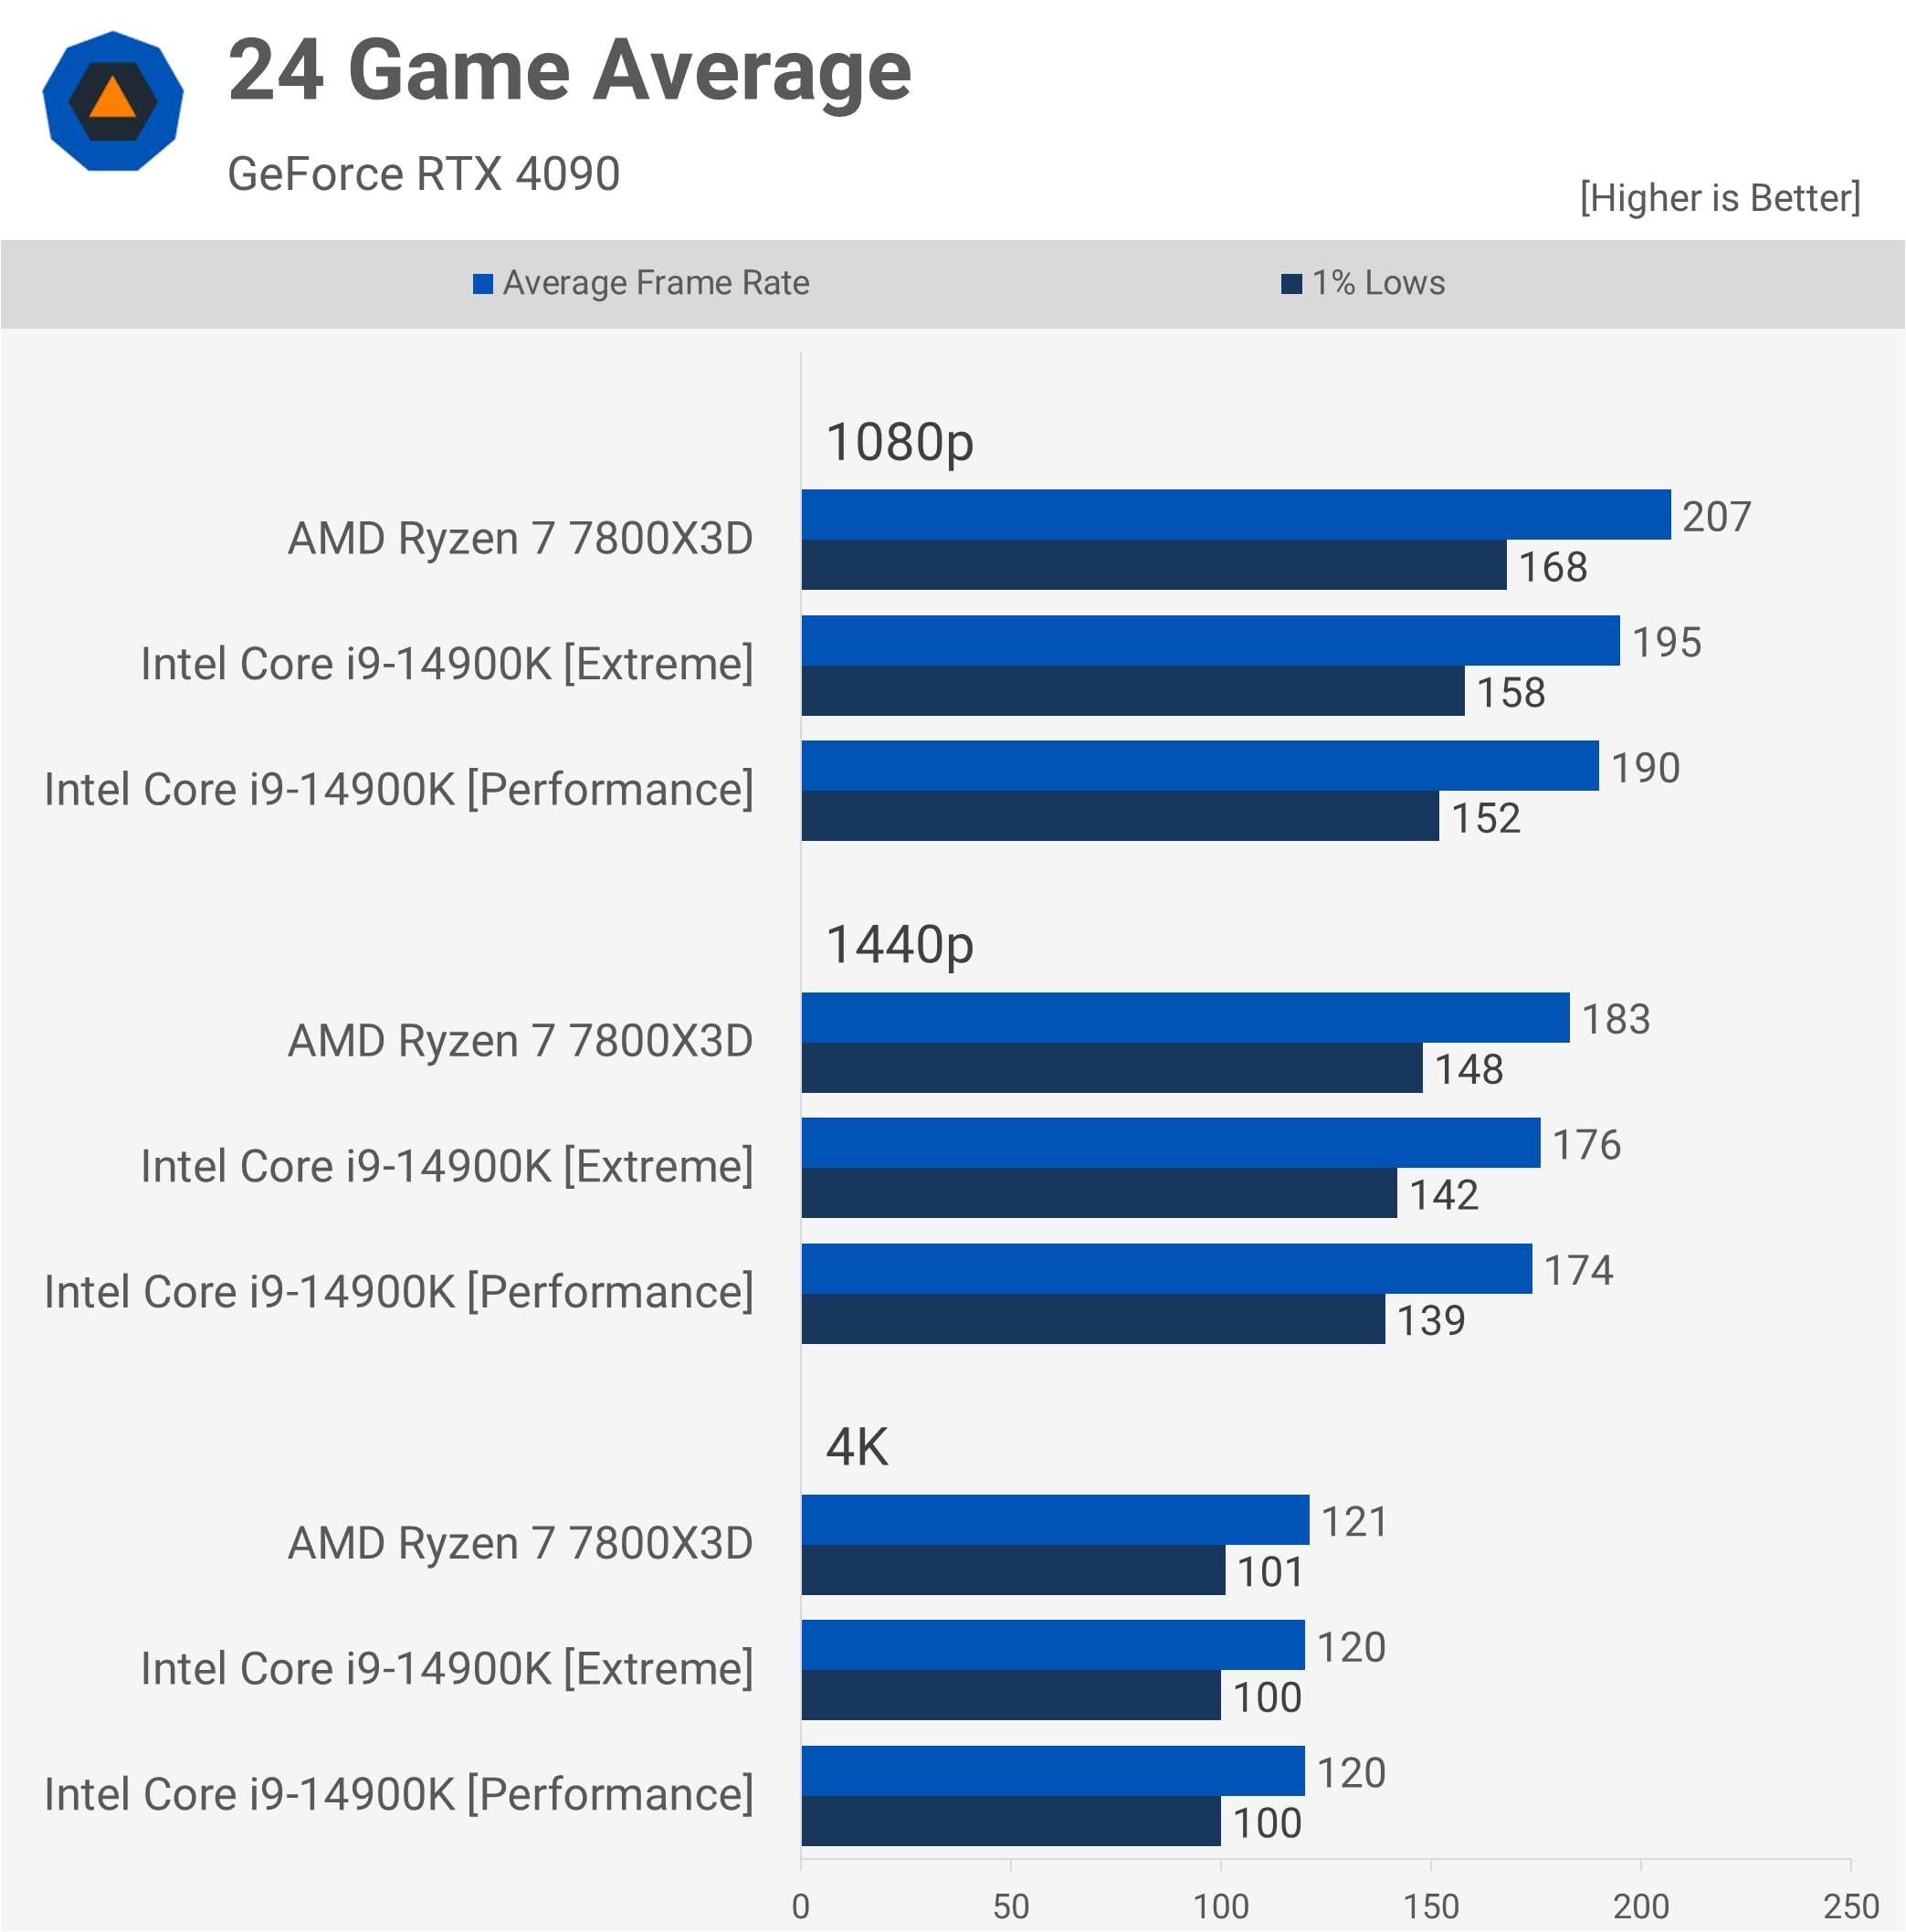
This also means that on average, we saw just a 3% difference between the performance and extreme profiles across our testing. Of course, there were examples where the margin was much greater, but there were also plenty of examples where the margin was negligible.
Running the ‘performance’ profile likely won’t result in a noticeable performance decline for gamers, which is positive. However, realistically, there’s little reason not to use the advertised ‘extreme’ profile that Intel has used previously for all their in-house benchmarking.
Performance vs Extreme Profiles
As seen before, the 7800X3D was 6% faster on average across the 24 games tested. Here’s a look at the margins across those games. The biggest win for the Ryzen processor came in ACC, where it was 33% faster. We also saw significant wins in Star Wars Jedi: Survivor, Baldur’s Gate 3, A Plague Tale: Requiem, Hogwarts Legacy, and Counter-Strike 2.
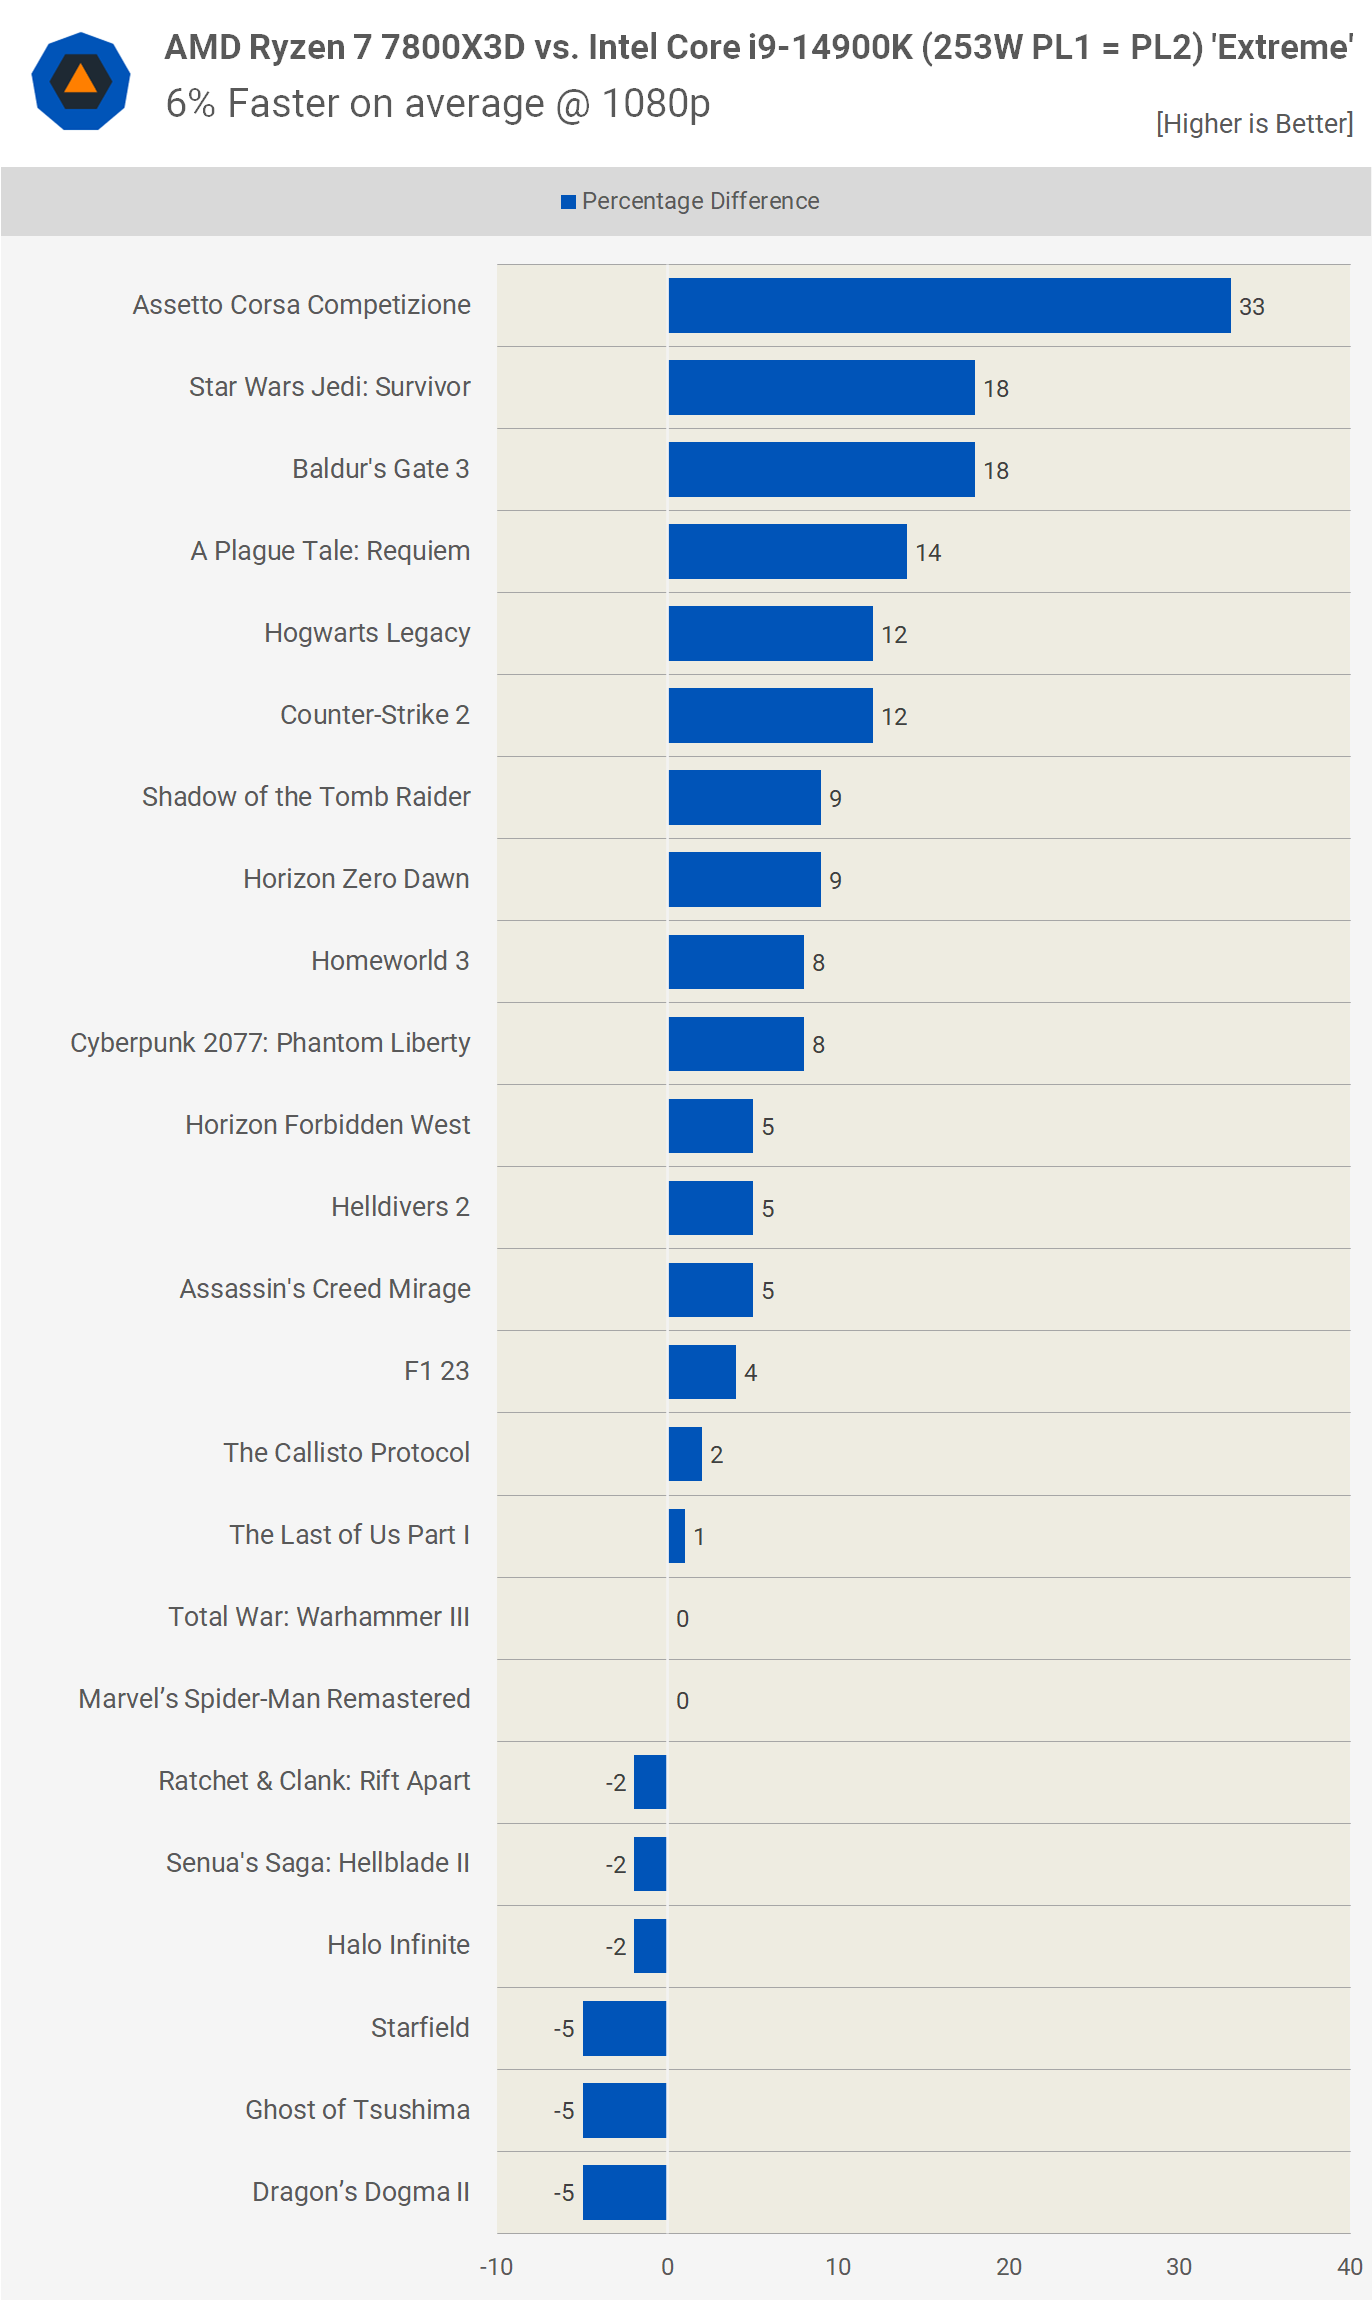
There was no single example where the 7800X3D was slower by more than a 5% margin, with the worst results for AMD seen when testing Starfield, Ghost of Tsushima, and Dragon’s Dogma II.
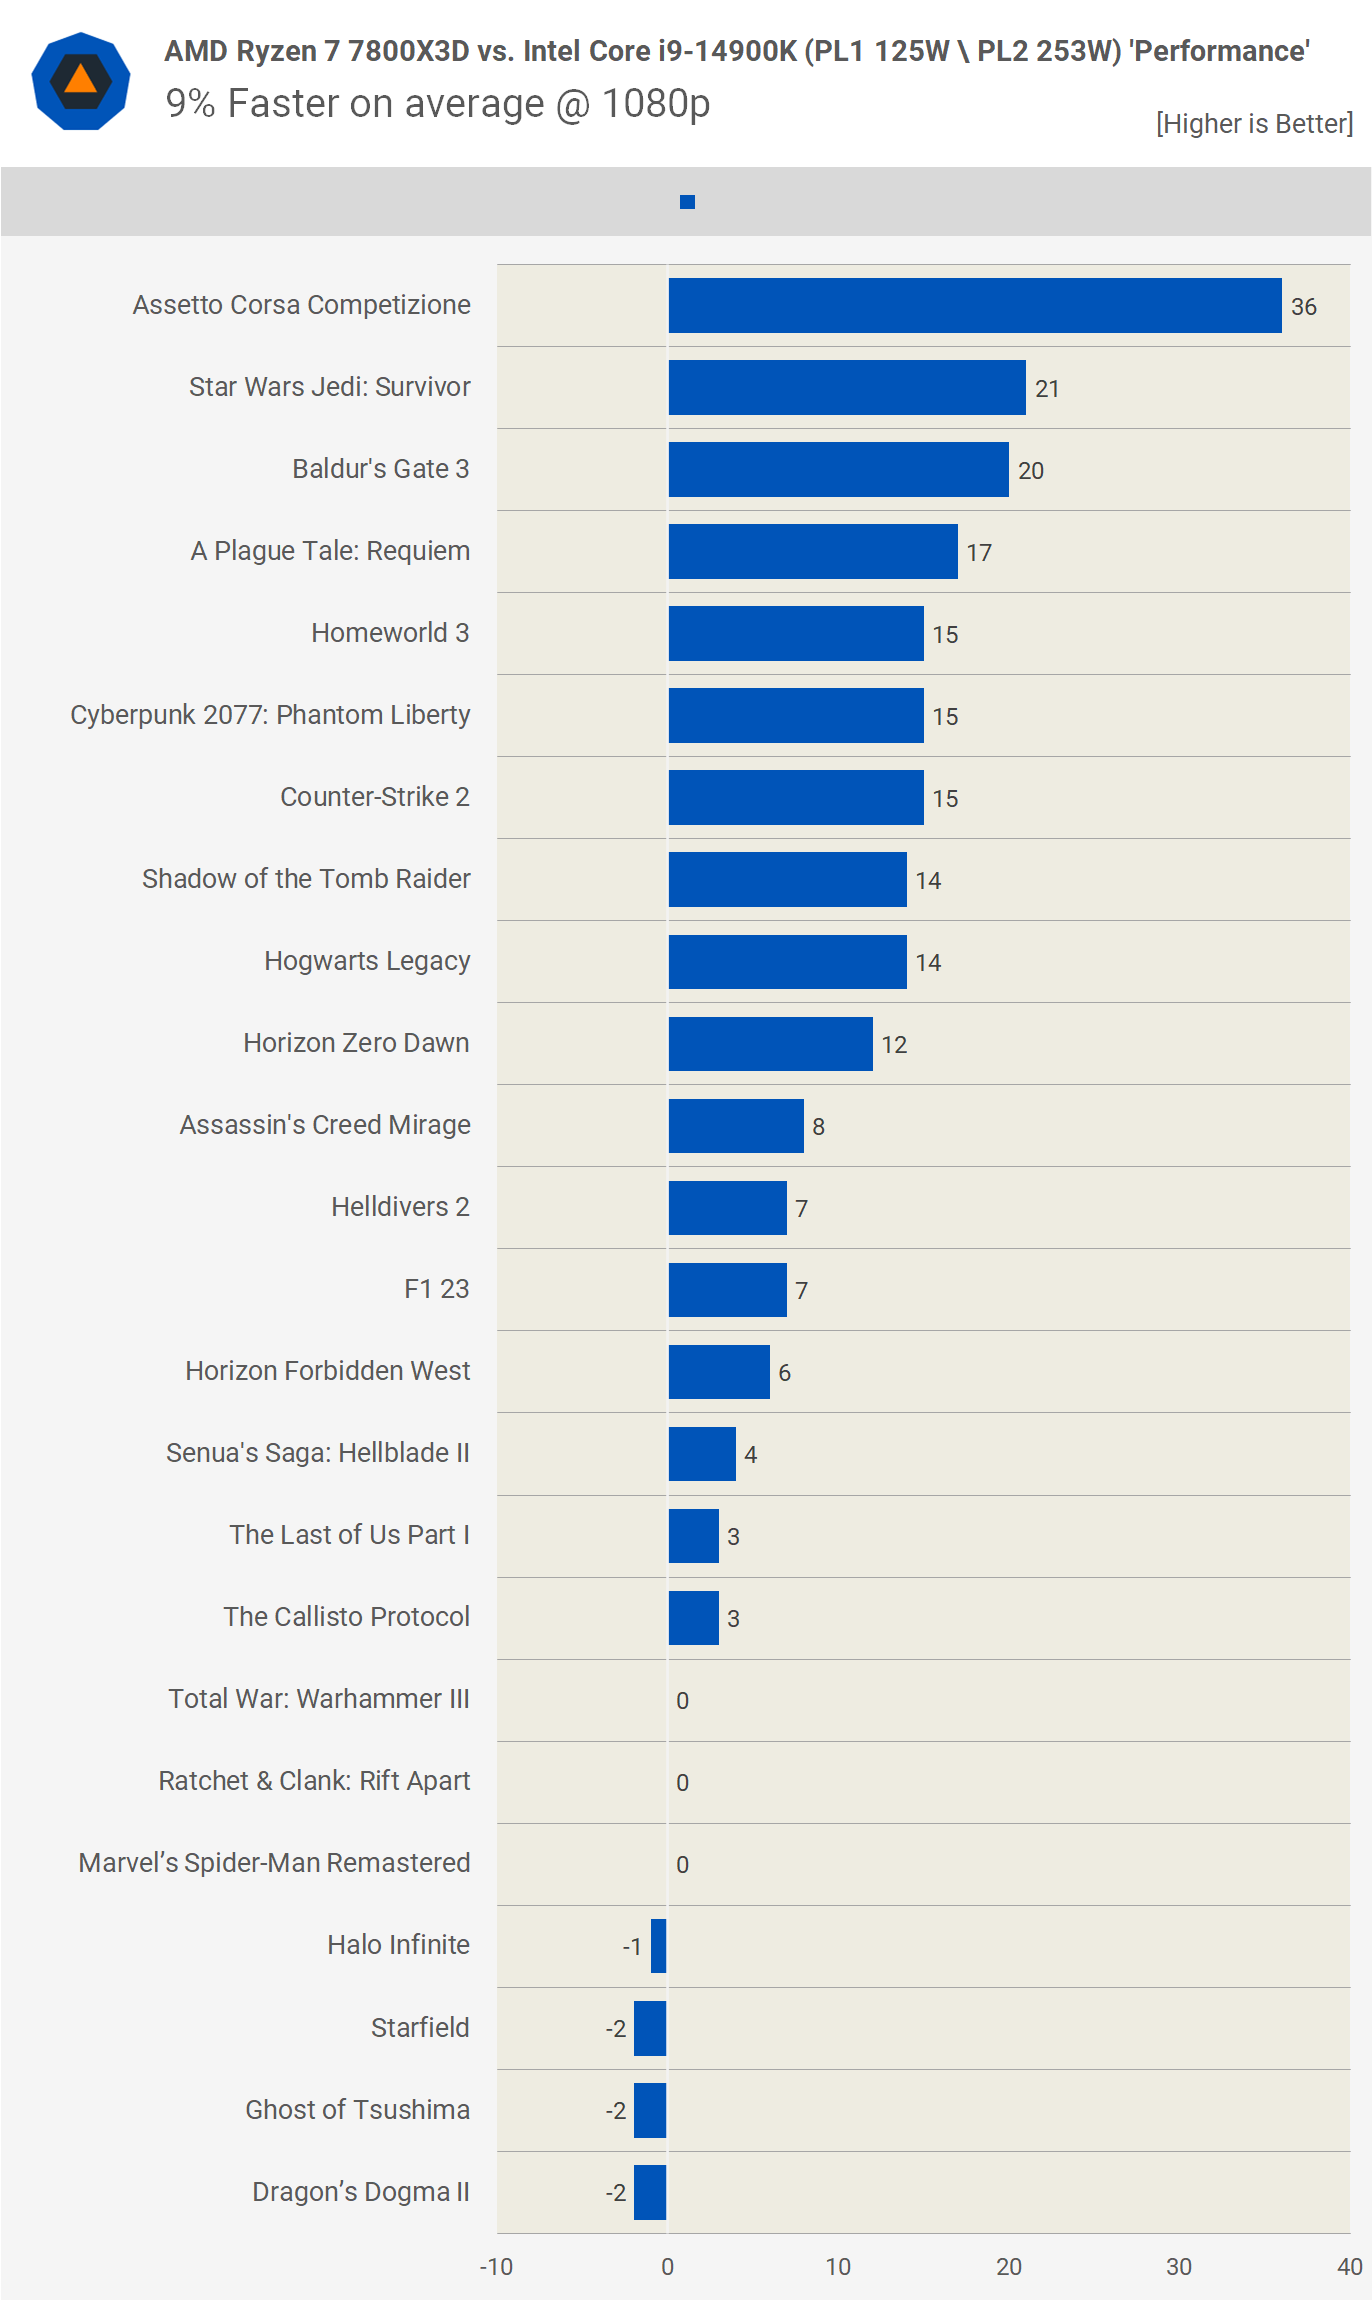
When running the 14900K using the performance mode, the 7800X3D is at worst 2% slower. In other words, when the Ryzen processor loses, the performance is about the same.
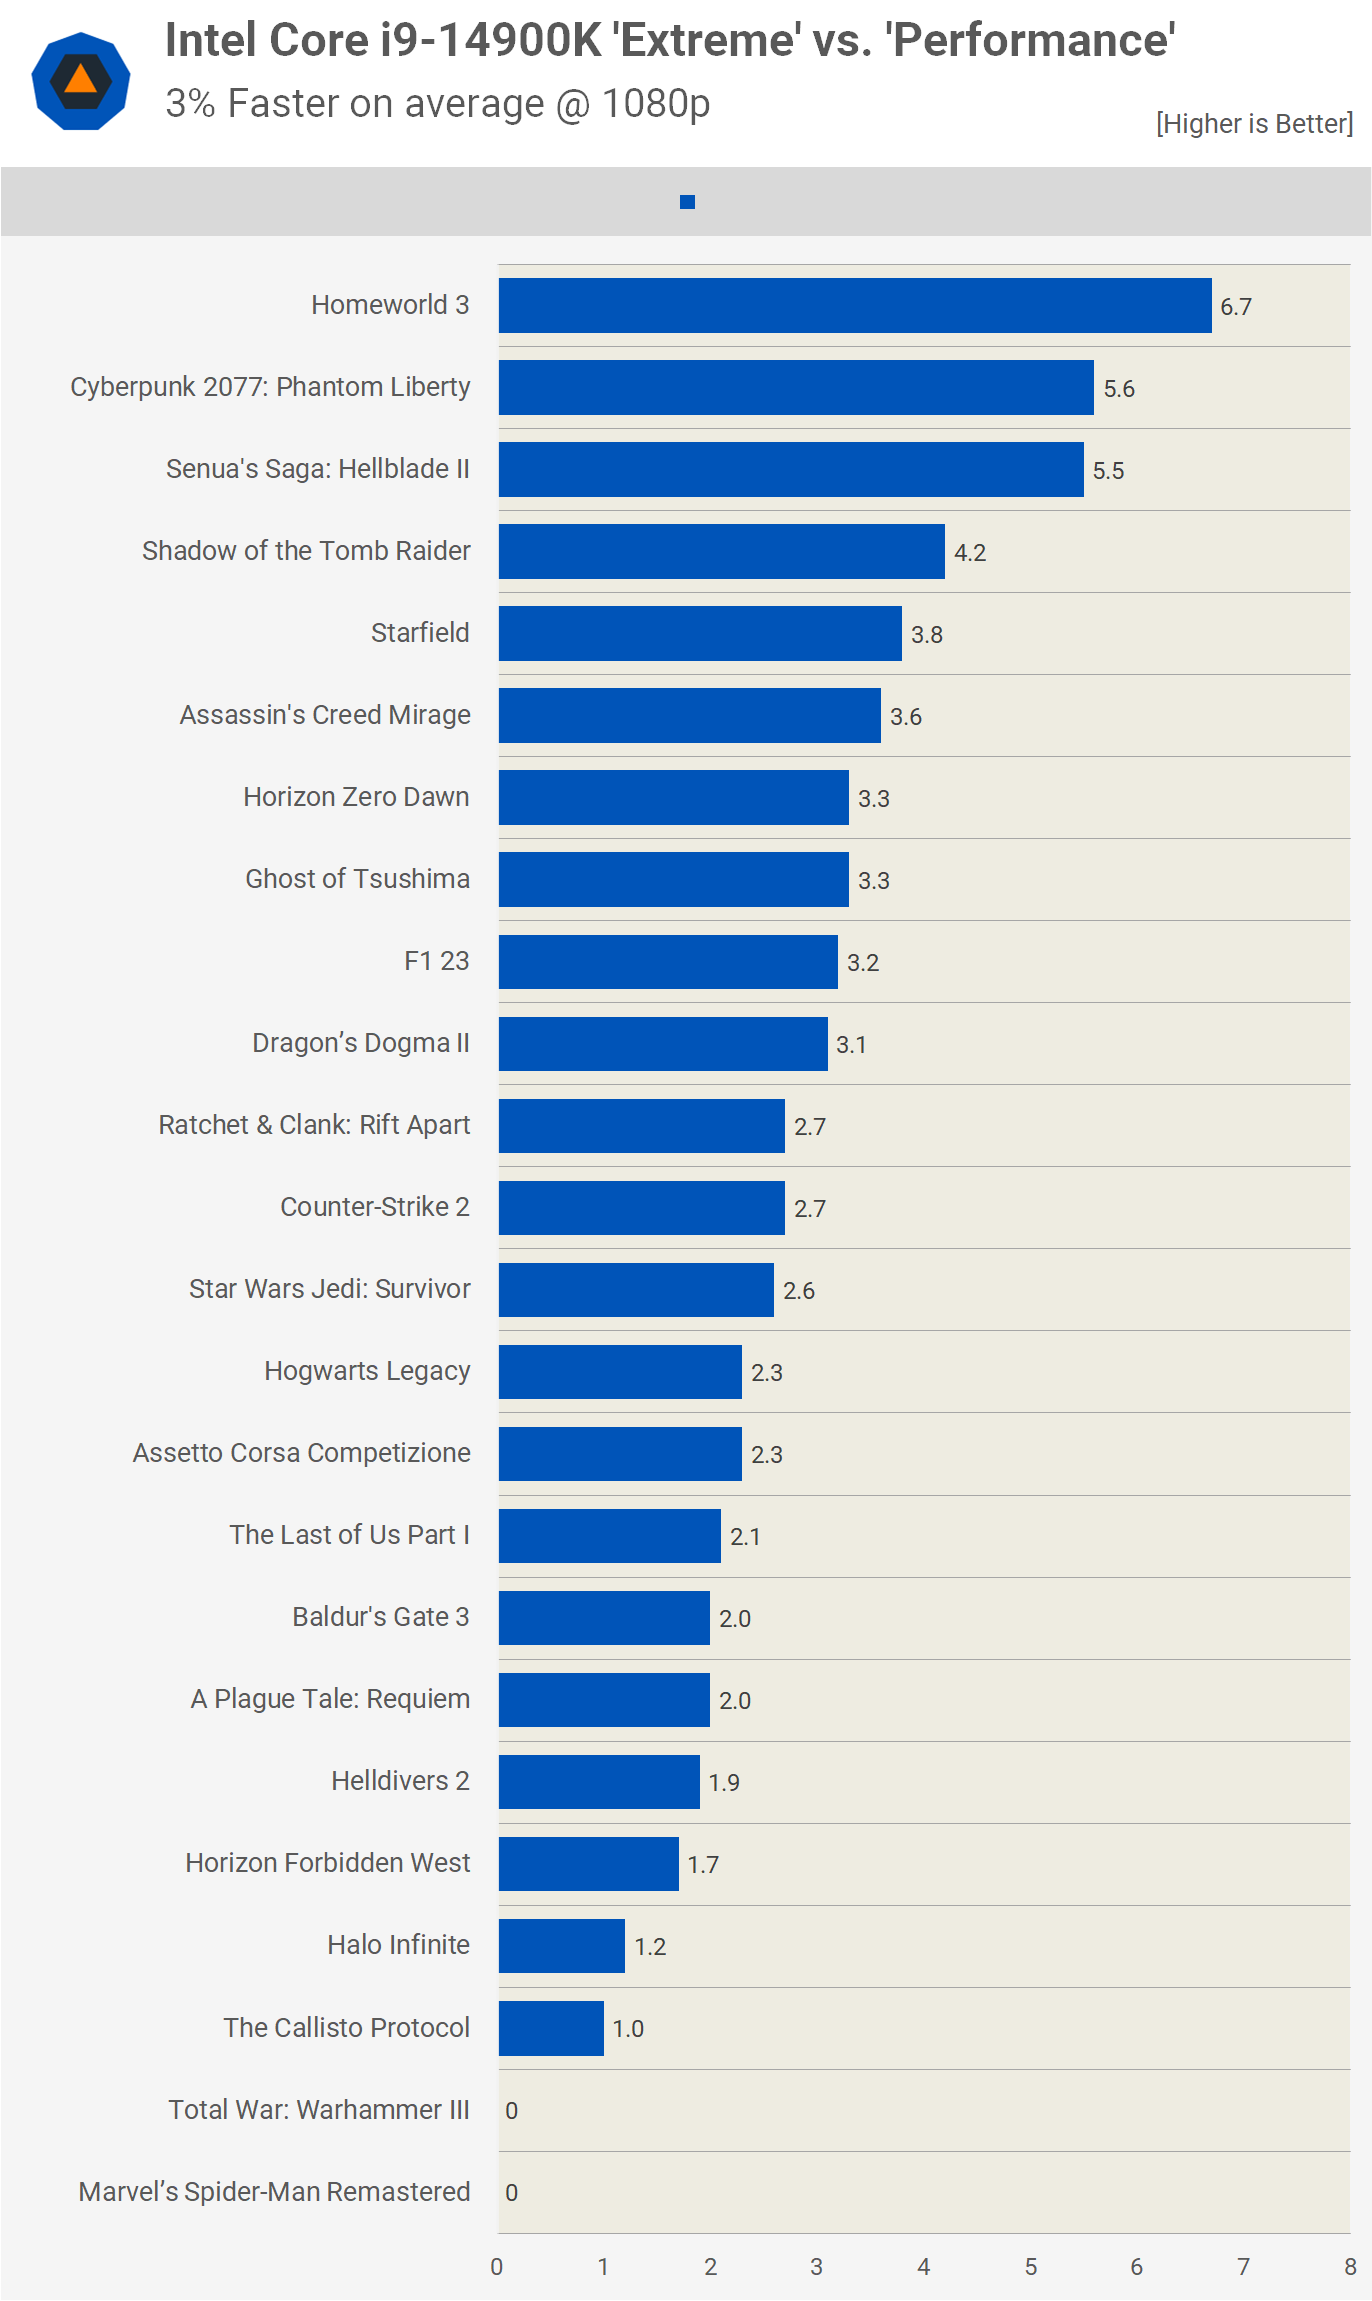
Finally, here’s a look at the 14900K running the Extreme profile compared to the Performance profile. On average, it was just 3% faster using the higher power Extreme mode, with the biggest margin reaching 7% in Homeworld 3, which is probably the most CPU-demanding game here. For the most part, we’re only looking at a difference of a few percent.
Power Usage
One big advantage of the 125W ‘performance’ profile is power consumption. Although still significantly higher than the 7800X3D, it’s a noteworthy improvement. For example, in Starfield, the 14900K delivered similar fps performance using either profile, but the ‘performance’ profile reduced total system usage by a massive 15%, shaving 100 watts off. This still represents a 25% increase over the 7800X3D for similar fps performance but is a substantial efficiency improvement for gaming.
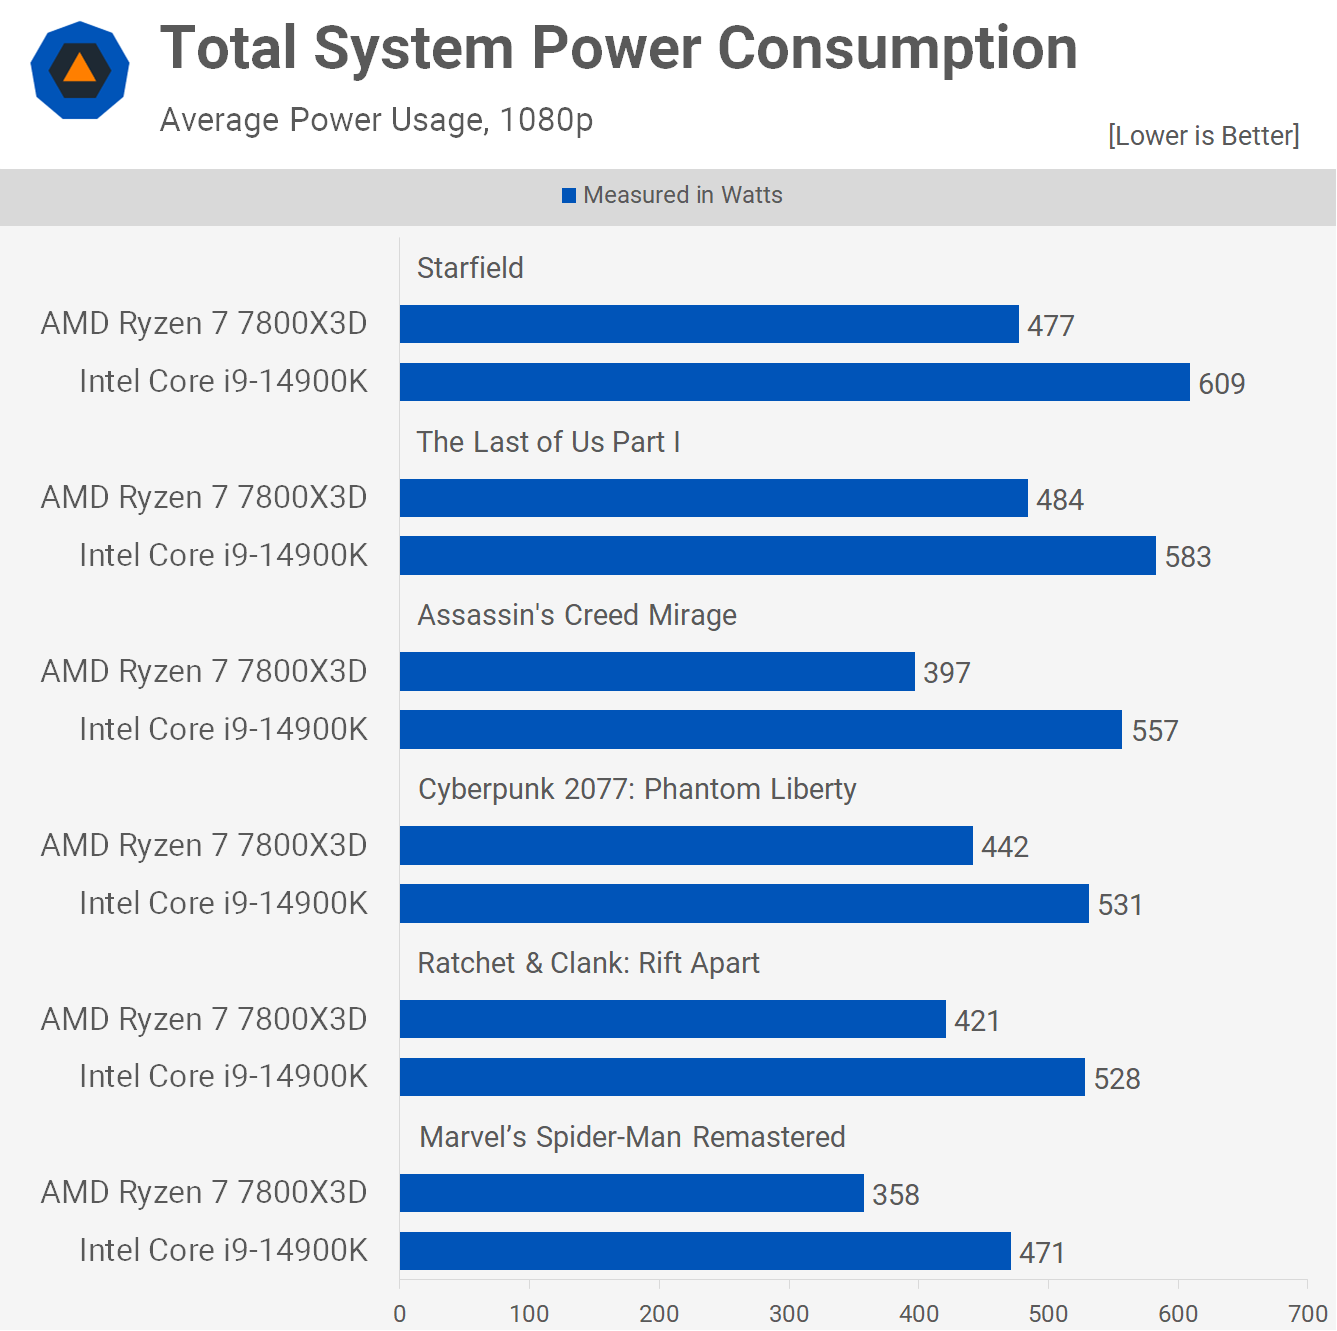
However, these improvements will vary from game to game. In Assassin’s Creed Mirage, we’re only looking at a 6% reduction in power usage, which is less impressive given the average frame rate dropped by 4% and the 1% lows by 10%.
We see a 12% power reduction in The Last of Us Part I, which is nice, though that’s still 25% more power than the 7800X3D required for a similar level of performance.
In Cyberpunk 2077, we saw an 8% reduction in power usage for the 14900K with the performance profile, but it still used 18% more power than the 7800X3D, which isn’t great for Intel, given that the 3D V-Cache part was 15% faster.
The 14900K saw its power usage reduced by 11%, down to 485 watts for the entire system in Spider-Man, which is nice but still 35% more than the 7800X3D, which averaged just 358 watts.
Finally, when testing with Ratchet & Clank: Rift Apart, the power usage was high using either profile. Switching to the ‘performance’ mode only reduced total system usage by 4%, and overall, we did see similar fps performance. Unfortunately, this means that even with the ‘performance’ profile, total system power usage is 43% higher than that of the 7800X3D.
What We Learned
So, there you have it. For gaming, not much has changed, which isn’t surprising given Intel has always tested their 12th, 13th, and 14th-gen CPUs using what we now call the “Extreme” profile, with PL1 = PL2 at 253 watts. Power consumption at 253 watts is still very high, even extreme, because the CPU is consuming 253 watts, which is a lot for a desktop CPU, and certainly much more than the 7800X3D, as we saw in our power testing.
Although the “Performance” mode did reduce power consumption by a reasonable margin for only a small performance decrease, the end result still wasn’t great, especially relative to the 7800X3D.

Having the ability to load a more power-efficient 125-watt profile for the 14900K is nice, but it’s unclear why Intel has this specification for these flagship K-SKU parts. After all, if you want a more efficient processor, you can just buy the non-K models, which will save you a fair chunk of change.
This raises questions about Intel’s intentions here. After recently speaking with multiple engineers from Intel’s board partners, we have speculated that Intel is using the “Performance” profile to avoid potential RMA requests from customers.
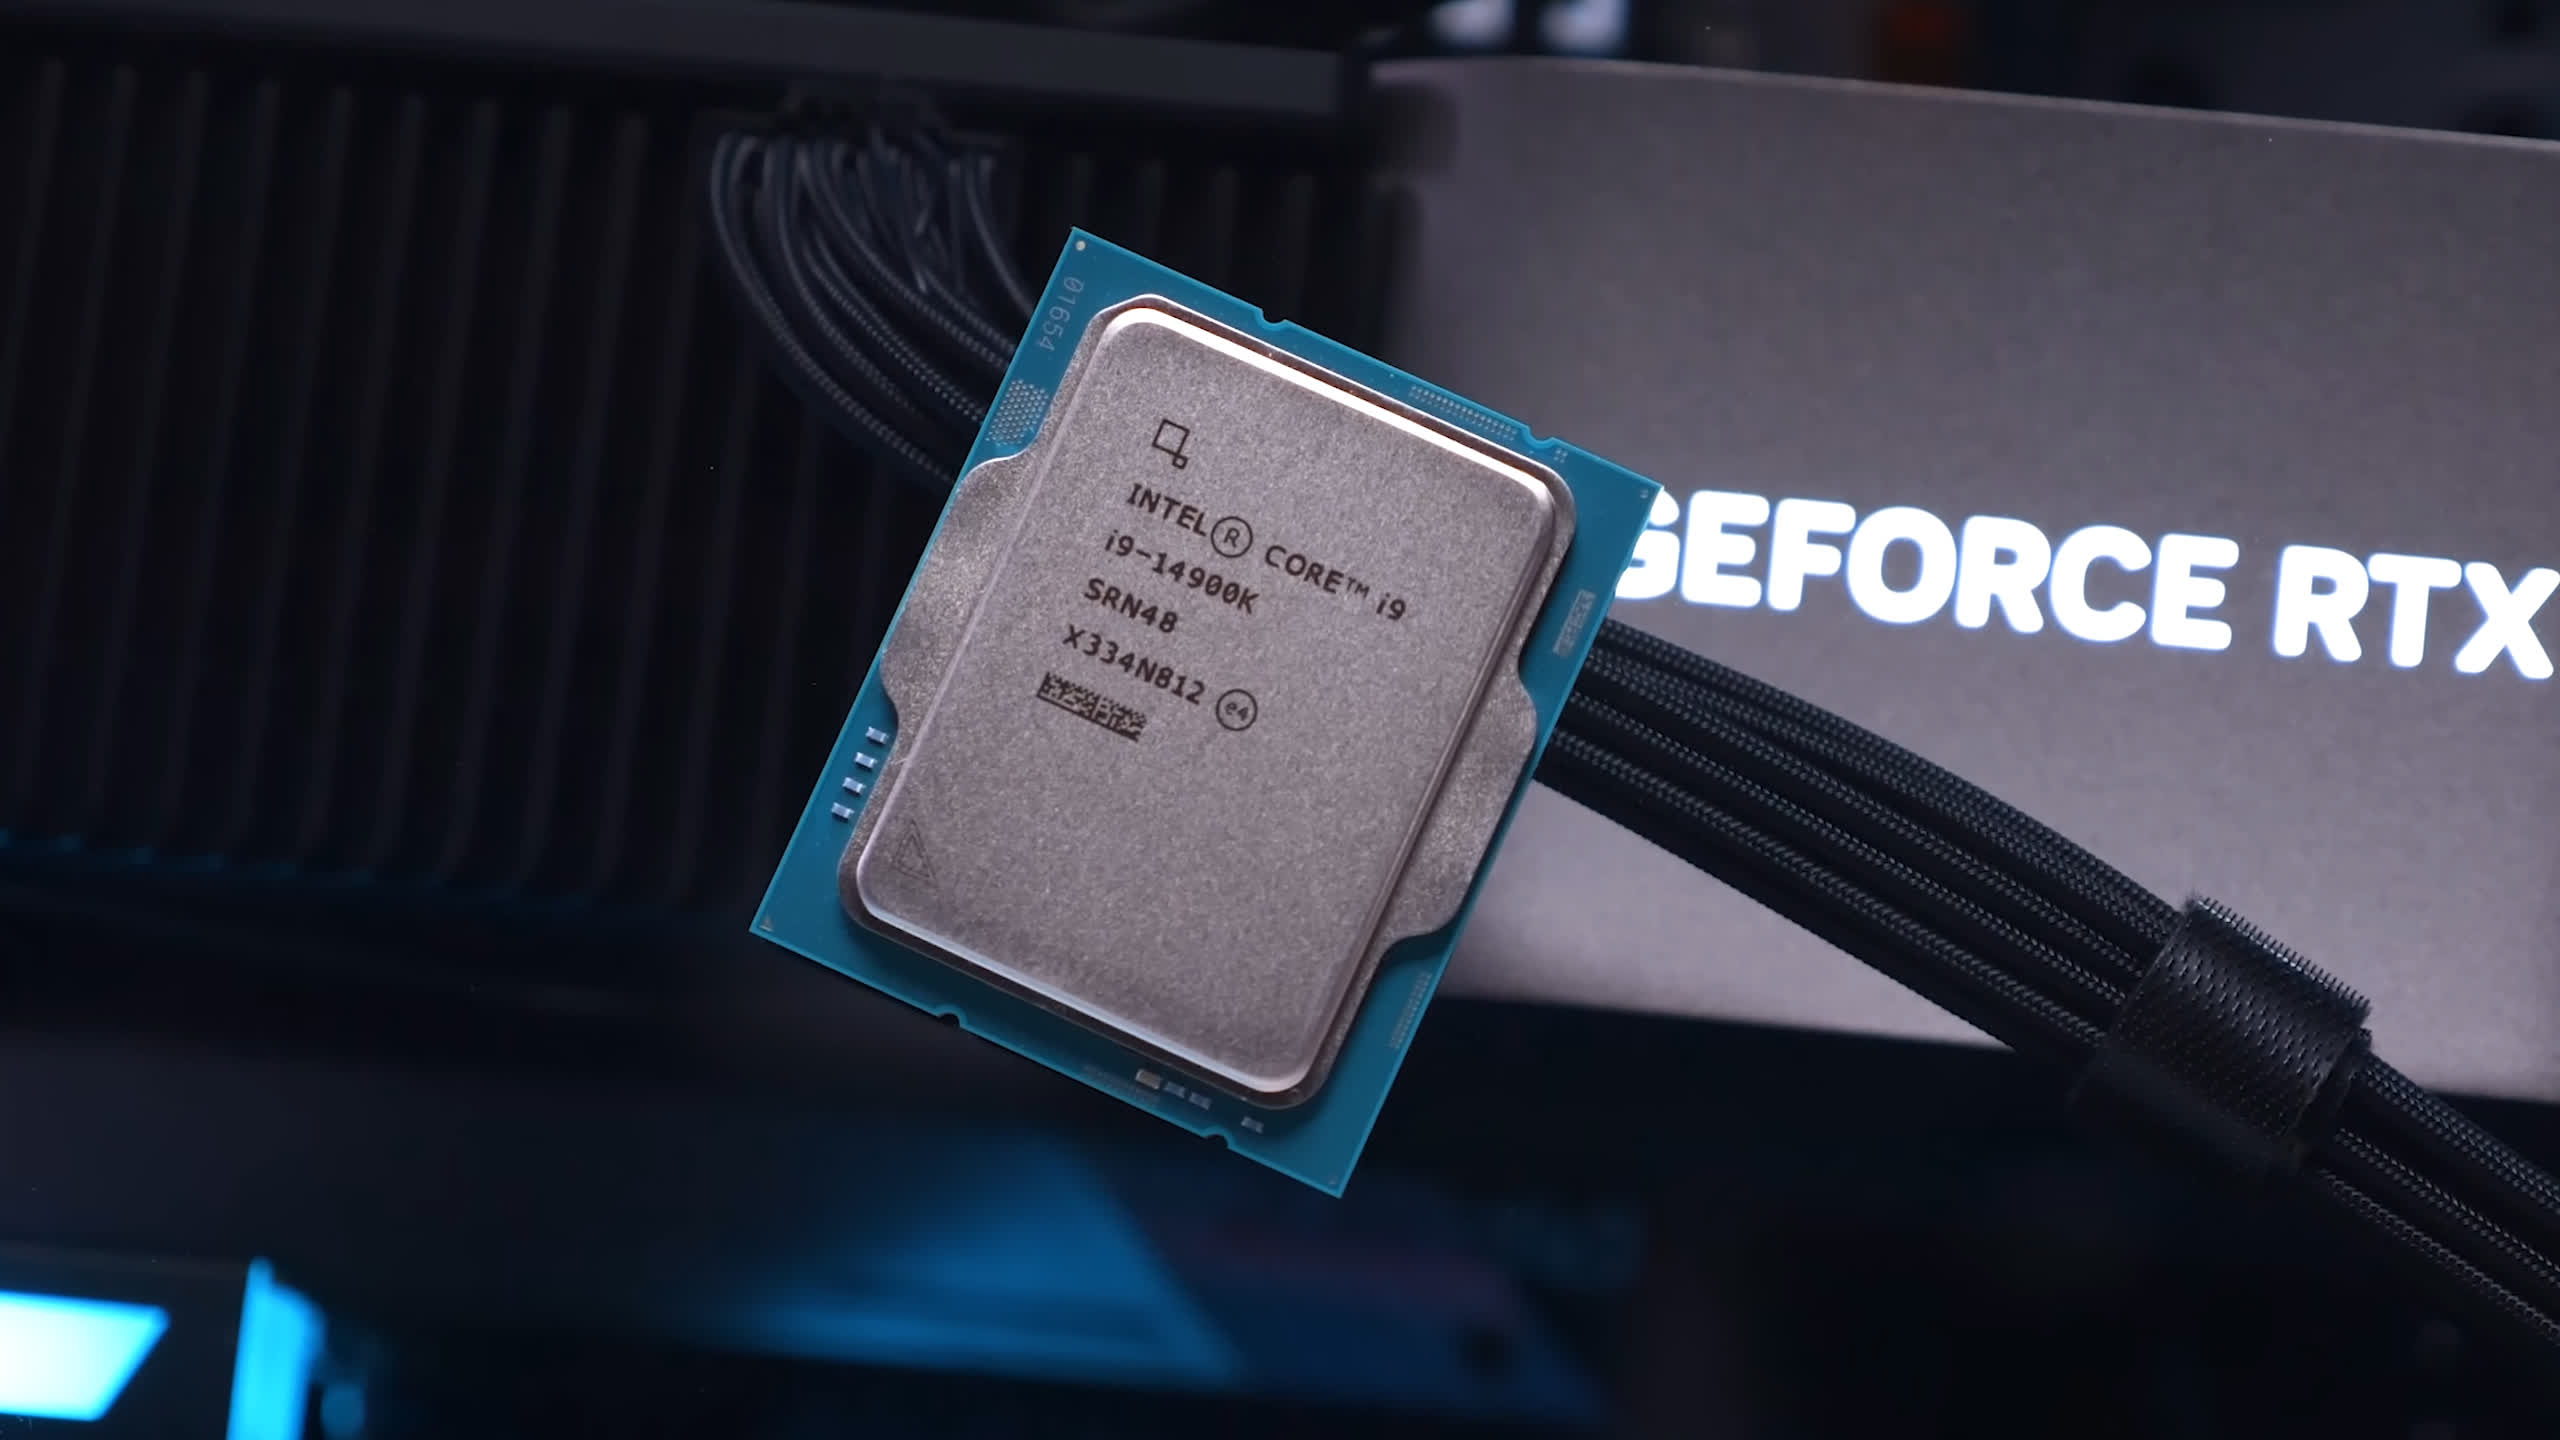
We’ve been told in no uncertain terms that some Intel Core i9 processors that have been running without power and safety limits have suffered silicon degradation. This is why many of them have started to run into stability issues, or at least there are many online reports of this happening.
Having the ability to tell those users that they must run the “Performance” profile to solve stability issues is a convenient solution for Intel. While we have no concrete evidence yet that this is what’s happening, it seems like the most plausible explanation for why Intel is now mandating that their partners include the Performance profile on all LGA 1700 motherboards.
Regardless of our speculations, the Performance profile need not exist for unlocked Z-series motherboards using unlocked K-SKU processors. The minimum configuration here should be the one Intel advertises, so PL1 = PL2 at 253 watts. Anything short of that is unacceptable.
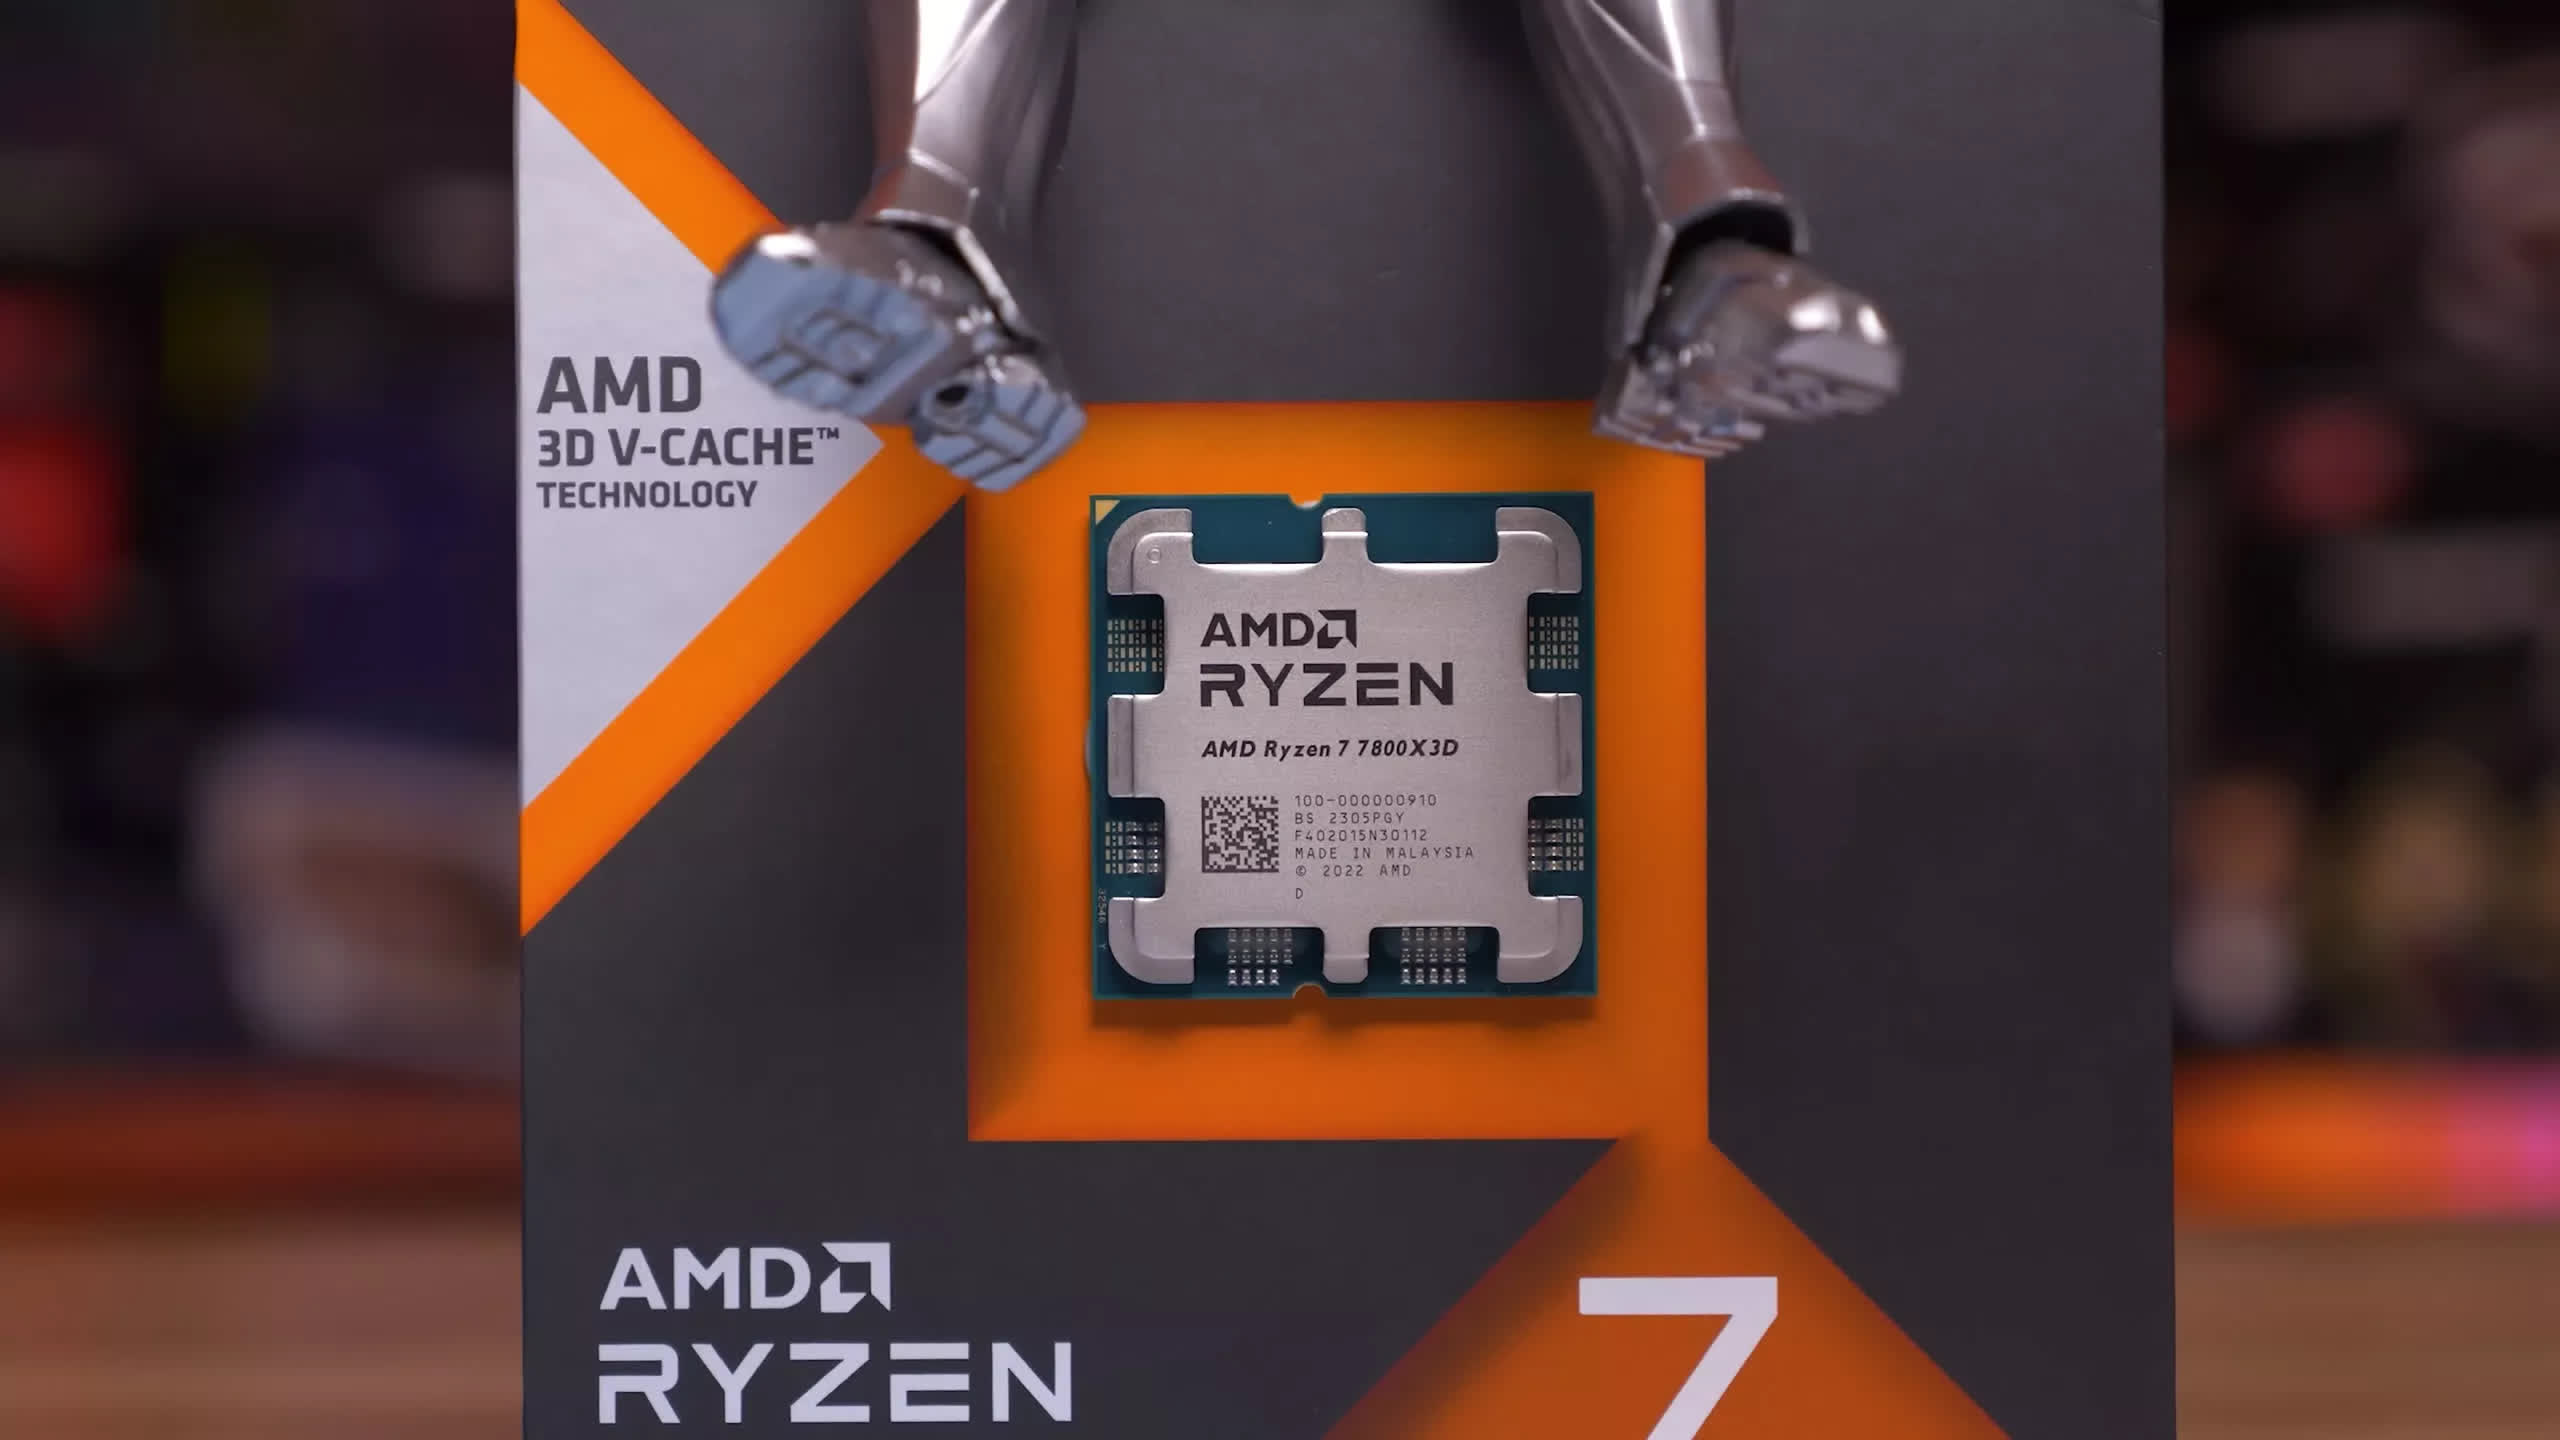
As for how all this new information changes our past reviews and recommendations, it doesn’t. Gaming performance isn’t significantly different from what we’ve shown in the past, nor is power efficiency. We still believe the 7800X3D is the better overall gaming CPU, especially in terms of value, given it costs just $340 right now – what a bargain.
The 14900K, on the other hand, costs considerably more at $550. While it is a much better productivity CPU, if that’s what you’re after, the 7950X3D might be worth considering, given it’s recently dropped to just $500.

The point is we never really recommended the 14900K or 13900K to gamers, as they cost too much, use way too much power, run very hot, and the LGA 1700 platform has no future. They’re by no means bad gaming CPUs; in fact, in terms of performance, they’re very good. But with a part such as the 7800X3D costing much less and typically a bit faster, the choice has always been obvious.
AMD has also just announced extended AM5 support to 2027+, which is great news for those who have already invested in the platform.
Finally, if you’ve just bought a Core i9 processor or have been running one without issue, just make sure you’re using the “Extreme” profile, and you should be fine. If you’ve been suffering stability issues and the Extreme profile is unstable, then you should seek a replacement part, as running at the “Performance” profile is unacceptable.


